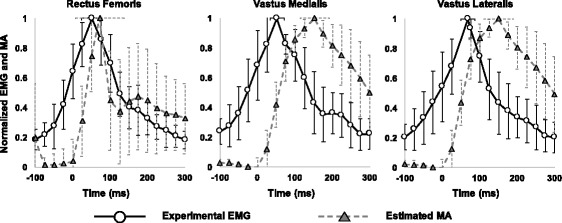
Fig. 4.

Comparisons of mean ± 1 standard deviation for experimental electromyography (EMG: circle and solid black line) and estimated muscle activation (MA: triangle and dashed gray line) during single-leg landing for all subjects. Both EMG and MA data were normalized by their peak values during landing. The horizontal error bar at the peak of the plot represents ±1 standard deviation for the peak time of the EMG and MA
