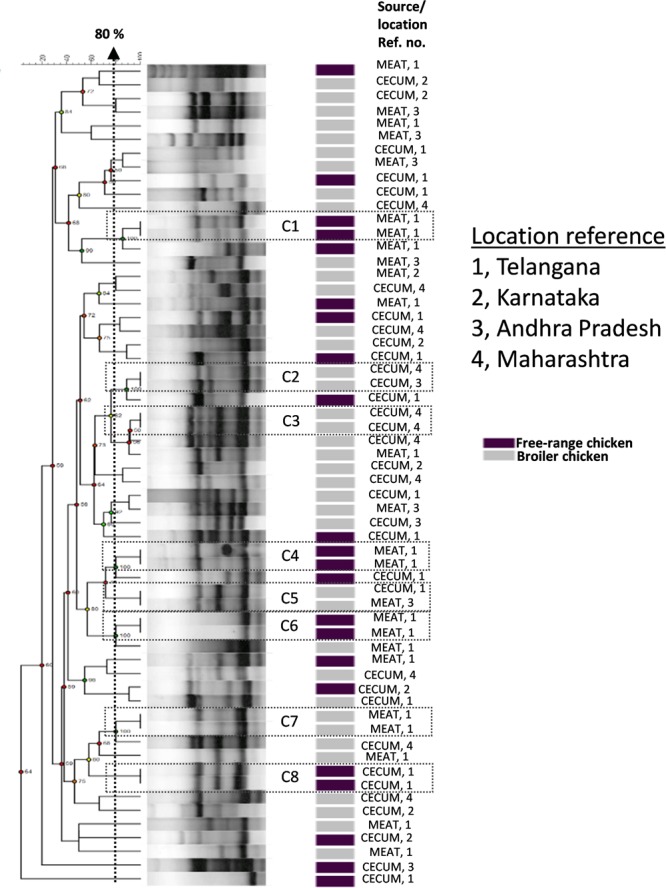
FIGURE 1.

Dendrogram representing genetic relationships of 38 broiler and 22 free-range chicken Escherichia coli isolates based on ERIC-PCR fingerprints. The clustering was performed by UPGMA algorithm based on Dice similarity coefficients. The genotypic patterns generated by ERIC-PCR were analyzed at 80% cutoff. Among the eight identical clades (C1 to C8), six clades corresponded consistently to geographic and isolation source.
