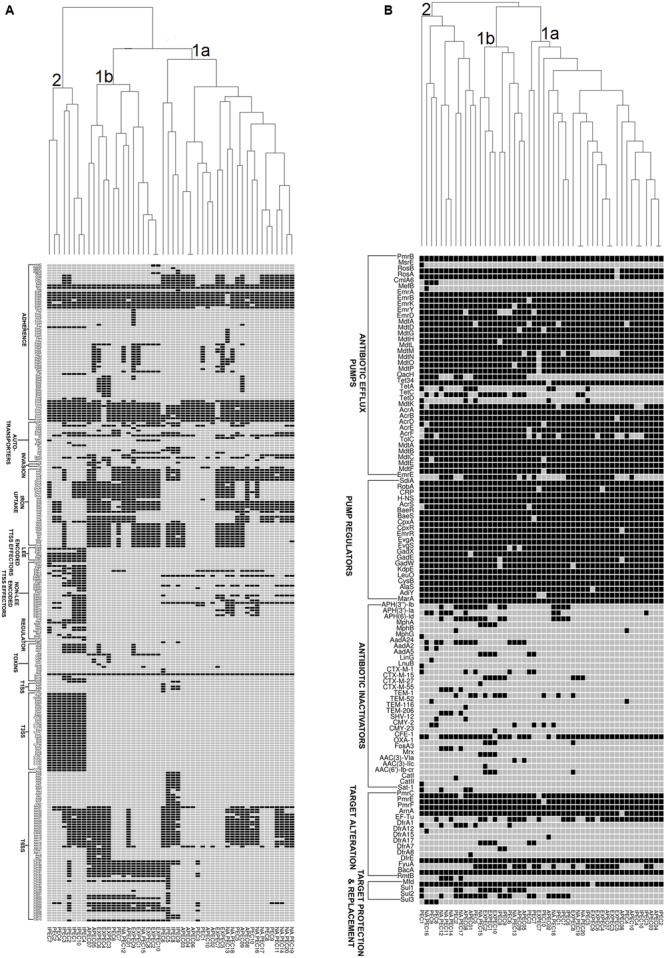
FIGURE 4.

Gene cluster results for 50 E. coli isolates: the presence (Black Square) and the absence (Gray Square) of virulence genes (A) and resistance genes (B) are represented in the image. Gene names are listed on the left. E. coli pathotypes are listed below the image (APEC: avian pathogenic E. coli, ExPEC: extraintestinal pathogenic E. coli, IPEC: intestinal pathogenic E. coli, PEC: healthy poultry E. coli, NA_PEC: in-house poultry E. coli). Results of resistance clustering indicated that only 50% of our poultry E. coli shared resistance genes with other E. coli pathotypes (distributed in mixed clusters 1a and 1b) and the rest formed a separate group (cluster 2, B). However, the virulence based cluster diagram showed that the in-house poultry (NAPEC) shared more virulence similarity with ExPEC and APEC genomes compared to intestinal pathogenic E. coli (IPEC), as cluster 2 of (A) was dominated by enteric E. coli genomes without any poultry E. coli genome.
