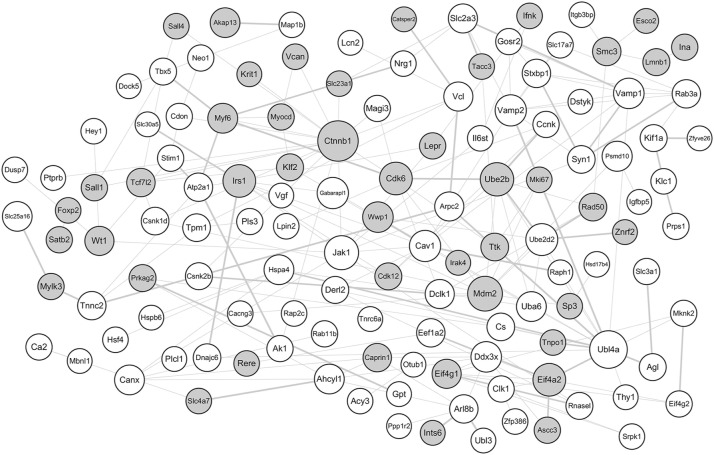
Figure 1.
PPI network of the screened DEGs.
Notes: The gray circles represent upregulated proteins, and the white circles represent downregulated proteins. The size of a protein is determined by the degree of its connection to other proteins, and the width of the edge connecting two proteins is determined by the combined score of two proteins.
Abbreviations: DEGs, differentially expressed genes; PPI, protein–protein interaction.

