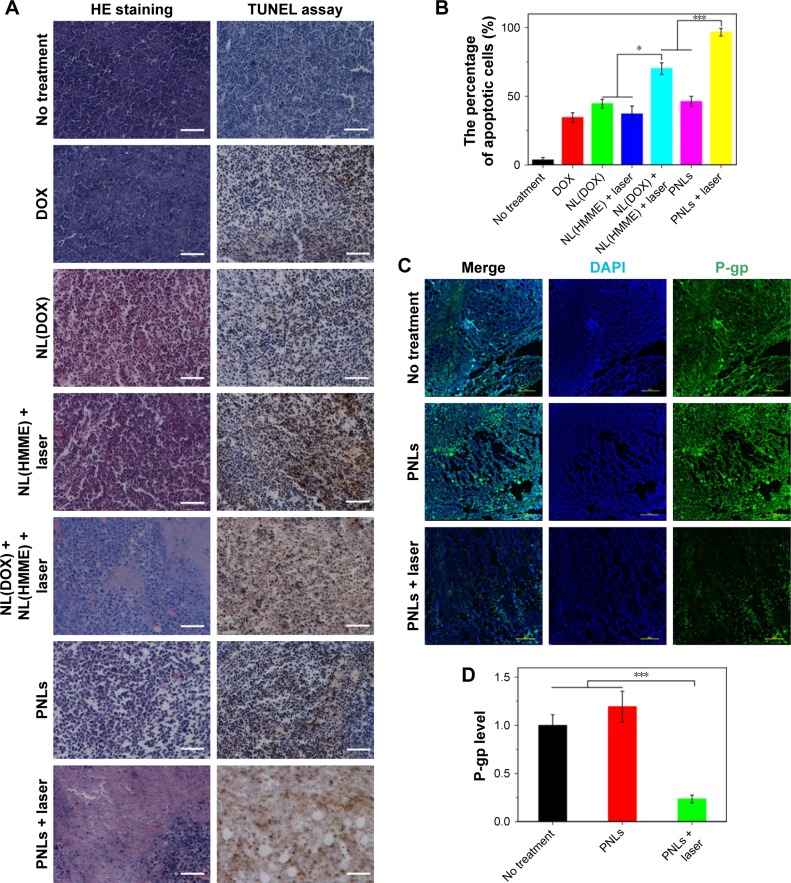
Figure 7.
Ex vivo analysis of the histological characteristics of tumor.
Notes: (A) HE and TUNEL staining images of tumor tissues in mice with different treatments for 15 days; scale bar represents 200 μm. (B) The percentage of apoptotic cells in tumor tissues with different treatments for 15 days (n=3). ***P<0.01, NL(DOX) + NL(HMME) + laser and PNLs vs PNLs + laser; *P<0.05, NL(DOX) and NL(HMME) + laser vs NL(DOX) + NL(HMME) + laser. (C) P-gp immunofluorescent staining images of tumor tissues in PNLs and PNLs + laser-treated mice; scale bar represents 200 μm. (D) Quantification of P-gp expression in tumor tissues – normalized to the no treatment control group (normalized to 1, n=3). ***P<0.01, no treatment and PNLs vs PNLs + laser. Data presented are mean ± SD.
Abbreviations: DOX, doxorubicin; HMME, hematoporphyrin monomethyl ether; NL(DOX), DOX-loaded nanoliposome; NL(HMME), HMME-loaded nanoliposome; P-gp, P-glycoprotein; PNLs, photo-activated nanoliposomes.

