Figure 7.
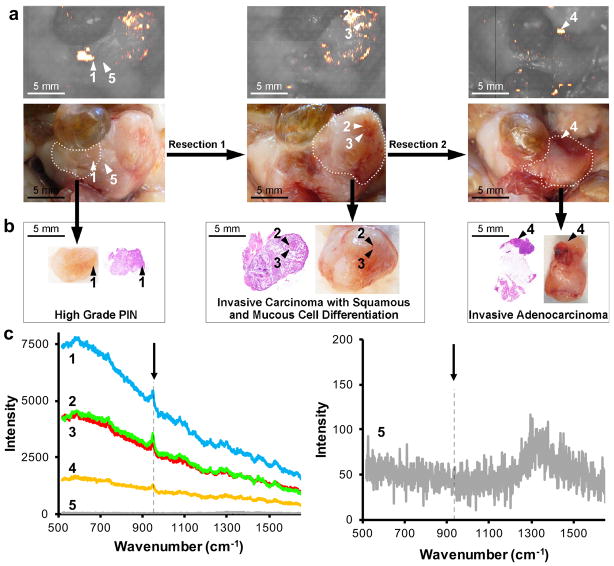
Contrast-enhanced Raman imaging of prostate neoplasia. (a) Raman image and photo of in situ prostate neoplasia detection using contrast-enhanced Raman imaging in a Hi-Myc mouse that was injected intravenously with PEGylated SERRS nanoparticles (30 fmol/g). A Raman-guided resection was performed of lesion 1. After resection 1, Raman imaging was performed and a second Raman-guided resection was performed along the dotted line. To screen for residual disease, Raman imaging was performed after resection 2. A residual lesion ‘4’ was found and biopsied. (b) Histopathological examination of H&E section of the excised tissues 1–4 identified lesion 1 as high-grade prostate intraepithelial neoplasia (PIN; a precursor lesion to prostate cancer), and lesion 2–4 as advanced prostate cancer. (c) Left panel shows the Raman spectra of the indicated lesion 1–4 and normal prostate tissue ‘5’ adjacent to lesion 1. The arrow indicates the diagnostic 950 cm−1 band of the injected SERRS nanoparticles. In the right panel the intensity is scaled between 0–200 to show the Raman spectrum of ‘5’. Reproduced and adapted with permission from Ref13. Appropriate institutional regulatory board permission was obtained.

