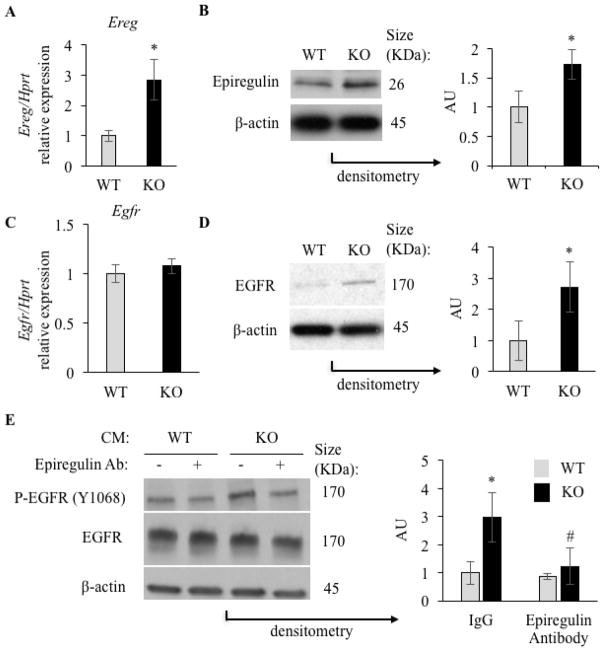
Figure 2.
A: Ereg expression in WT and Nf1-deficient mBMSCs (qPCR, n=3). B: Epiregulin protein expression in WT and Nf1-deficient mBMSCs (Western blot, n=3, Right graph: densitometric analysis). C: Egfr expression in WT and Nf1-deficient mBMSCs (qPCR, n=3). D: EGFR protein expression in WT and Nf1 deficient mBMSCs (Western blot, n=3, Right graph: densitometric analysis). E: Level of phosphorylated EGFR (p-EGFR), EGFR and β-actin in A431 cells treated with the conditioned medium (CM) from WT (grey bar) and Nf1-deficient (KO, black bar) mBMSCs in the presence of IgG control or an epiregulin neutralizing antibody (Western blot, n=3, Right graph: densitometric analysis). * and #: p<0.05 between genotypes and treatments, respectively. qPCR gene expression is normalized by Hprt expression.

