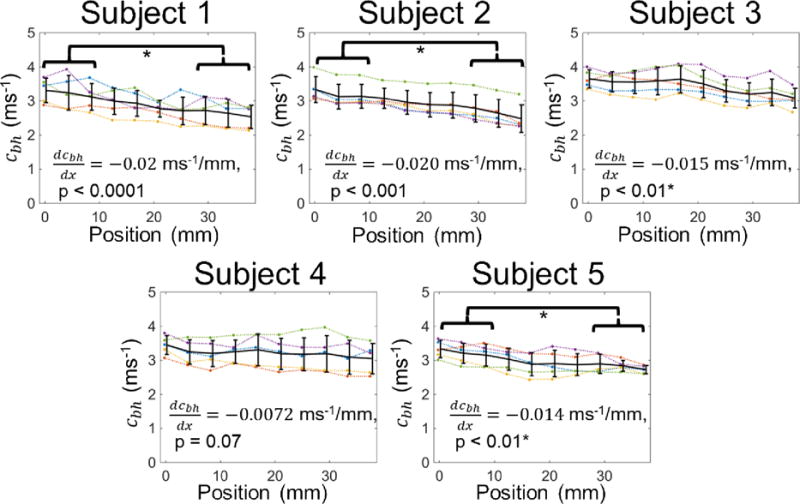
Figure 5.

Pulse wave velocity distribution recovered by the PWIP for all subjects. Individual inversions are shown as dotted lines, and the mean and standard deviation at each location are plotted as solid lines. The PWV had a downward trend in all cases which was significant for subjects, 1, 2, 3 and 5, and significant differences between the PWV at the two ends of the probe were found for subjects 1, 2 and 5.
