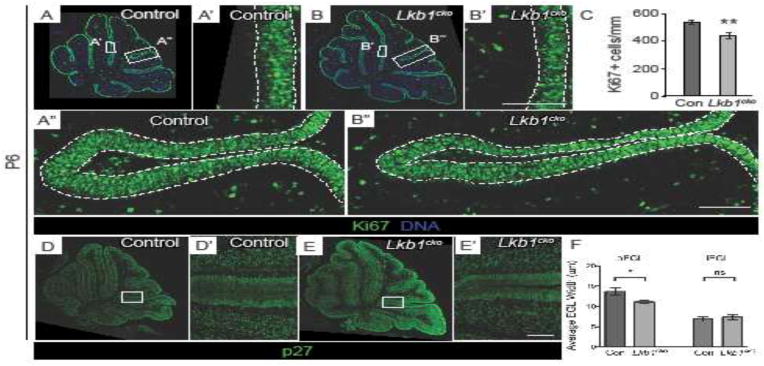
Figure 5. Loss of Lkb1 from granule cell precursors results in a thinner outer EGL.

A–B. Representative Ki67-stained P6 control (A) and Lkb1cko (B) cerebella. Dashed lines in A′–A″ and B′–B″ delimit outer EGL, where proliferative cells reside. Lkb1cko have a visibly thinner layer of proliferative (Ki67+) GCPs than do controls (compare A′ to B′, A″ to B″). C. Quantification of oEGL thickness using Ki67+ cells per mm EGL. n=3, p<0.01, Student’s t-test. D–E. Representative p27-stained P6 control (D) and Lkb1cko (E) cerebella. Dashed lines in D′ and E′ delimit inner EGL, where differentiating cells reside. F. Quantification of average thickness of oEGL (p<0.05) and iEGL (p=0.6), Student’s t-test. Scalebar 50 μm. Con = control.
