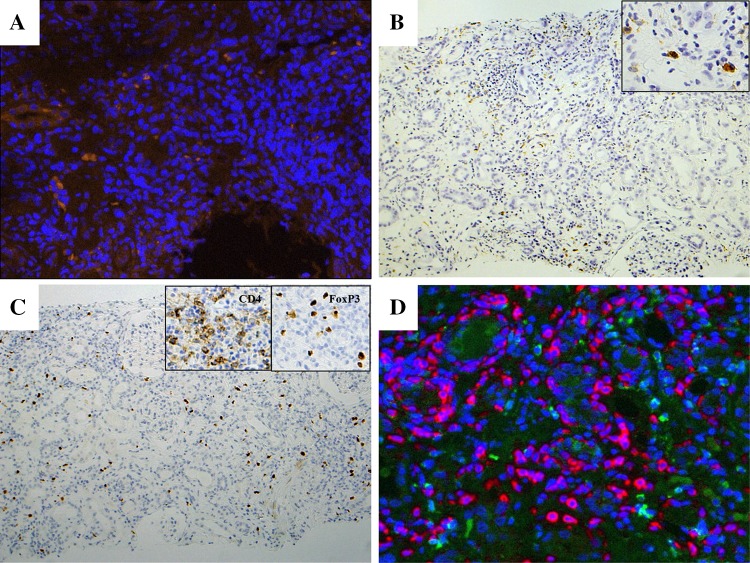
Fig. 4.
Immunofluorescent study showed several CD1a positive DCs (orange) within massive cell infiltration (blue) (magnification, ×200) (a). While immunohistochemical study revealed CD68 positive Mϕ showed similar distribution (magnification, ×100). Boxed area showed positive cells in high power field (magnification, ×400) (b). Immunohistochemical study revealed FoxP3 positive cells also proliferated. (magnification, ×100). Boxed area constituted CD4 and FoxP3 positive cells images, respectively (magnification, ×400) (c). Immunofluorescent study by Mantra Quantitative Pathology Imaging System showed the distribution of CD8 positive cells (red), CD4 positive cells (green), FoxP3 positive cells (cyan), and all nuclei (blue) in the interstitium (d)

