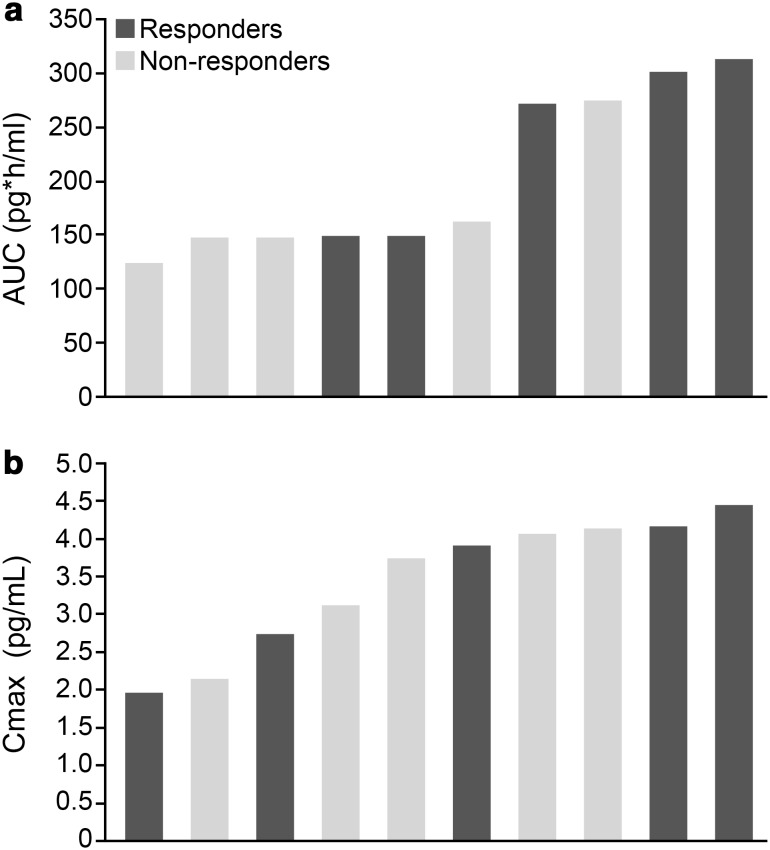
Fig. 4.
Waterfall plot of iPTH responders and non-responders at week 4 in the PPS in relation to DP001 AUC0–inf (a) and C max (b). AUC 0–inf area under the plasma concentration–time curve from time zero extrapolated to infinity, C max maximum plasma concentration, iPTH intact parathyroid hormone, PPS per protocol set

