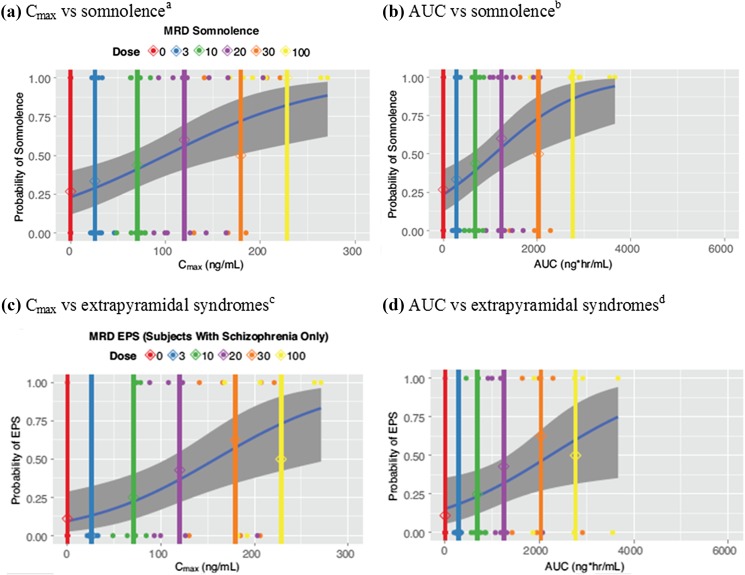
Fig. 4.
Probability of adverse event occurrence with multiple rising doses of TAK-063 in healthy Japanese subjects and SSS: a C max vs somnolencea; b AUC vs somnolenceb; c C max vs extrapyramidal syndromesc; d AUC vs extrapyramidal syndromesd; Observed (points) and predicted (blue line) incidence of EPS (SSS only) and somnolence vs TAK-063 C max or AUC. Vertical lines indicate the mean TAK-063 C max or AUC by dose; shaded regions indicate the 95% confidence interval. AUC area under the plasma concentration–time curve, C max maximum observed plasma concentration, EPS extrapyramidal syndromes, MRD multiple rising dose, SE standard error, SSS subjects with stable schizophrenia. a β (SE) = − 1.22 (0.40); slope (SE) = 0.012 (0.0038). b β (SE) = − 1.18 (0.39); slope (SE) = 0.001 (0.0003). c β (SE) = − 1.95 (0.62); slope (SE) = 0.011 (0.0043). d β (SE) = − 1.70 (0.56); slope (SE) = 0.001 (0.0003)

