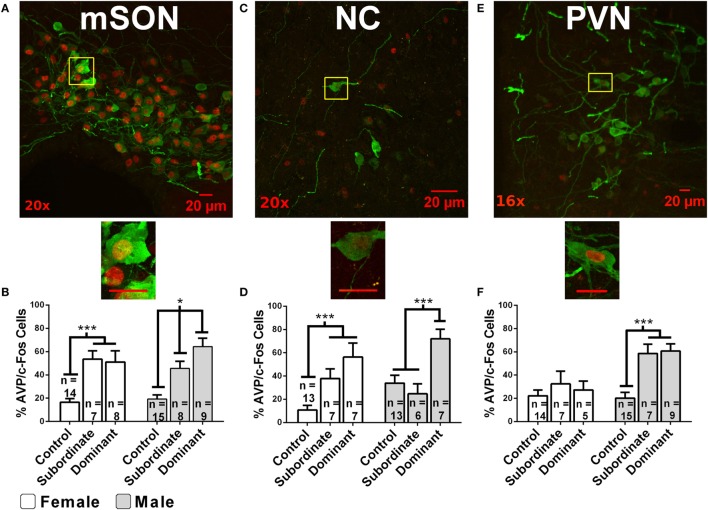
Figure 2.
Immunofluorescent colocalization of AVP-ir (green) and fos-ir (red) in cells within the following hypothalamic nuclei: the medial supraoptic nucleus [mSON; (A,B)], nucleus circularis [NC; (C,D)], and medial paraventricular nucleus [PVN; (E,F)]. Magnification is indicated in the bottom left corner. Yellow boxes indicate subregions magnified to 40×. Scale bars are 20 µM. Graphs indicate the percentage of AVP-ir cells that colocalize with fos-ir cells (% of activated AVP cells) as a function of acquired dominance status and sex in the mSON, NC, or PVN. White arrows indicate AVP-ir cells colocalized with fos-ir. Error bars indicate SEM. * indicates p < 0.05 and *** indicates p < 0.01 [figure modified from Ref. (69) with permission].

