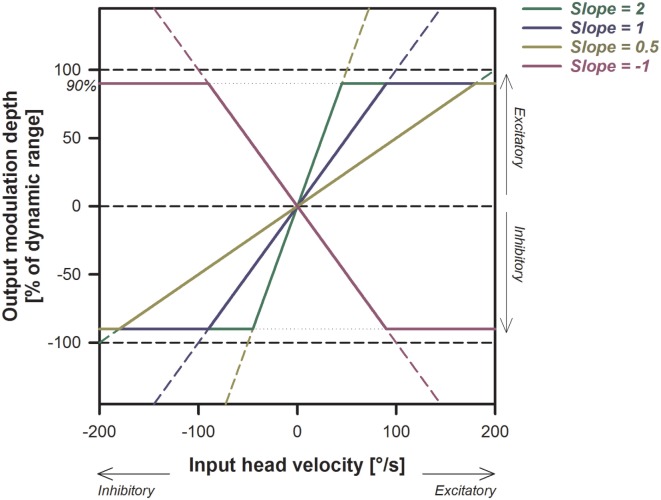
Figure 1.
Illustration of the electrical stimulation paradigm and its expected effects on the stimulation output. Examples of different linear transfer functions with slopes ranging from −1 to +2 are presented. Note that the increase in the output (modulation strength) is steeper for larger slopes. Positive slopes (yellow, blue, and green solid lines) generate excitatory stimulation (up-modulation) for excitatory head movements and inhibitory stimulation (down-modulation) for inhibitory head movements. Negative slopes (pink solid line) have the opposite behavior.

