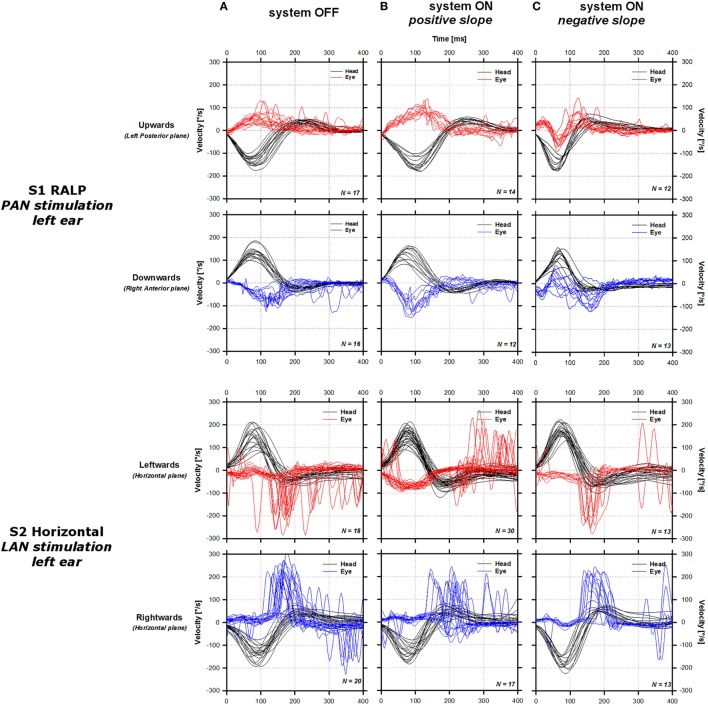
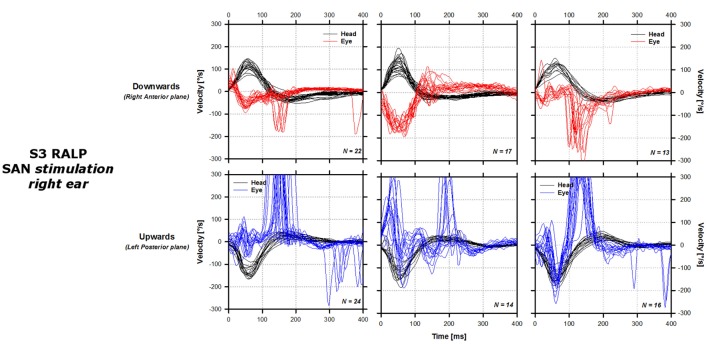
Figure 2.
Sample video head impulse test responses of the three tested patients around one of the tested planes. For each patient [S1 right anterior–left posterior (RALP), upper lines; S2 horizontal, middle lines; S3 RALP, lower lines], the panels in the first column show data gathered without stimulation [system OFF condition (A)]. The panels in the second column show data gathered upon stimulation using a linear transfer function with a positive slope [system ON positive slope (B); S1: 4 µA/°/s, S2: 3 µA/°/s, S3: 2 µA/°/s]. Panels in the third column show data gathered upon stimulation using a linear transfer function with a negative slope [system ON negative slope (C); S1: −2 μA/°/s, S2: −0.5 μA/°/s, S3: −2 μA/°/s]. Solid black lines represent the cycle plots of the angular velocity of the head around the tested plane. Solid red and blue lines represent the cycle plots of the angular velocity of the eye in the plane of the tested canal for excitatory (red) and inhibitory impulses (blue). Positive values correspond to motion directed leftward in the horizontal plane, and motion directed downward in the vertical plane.


