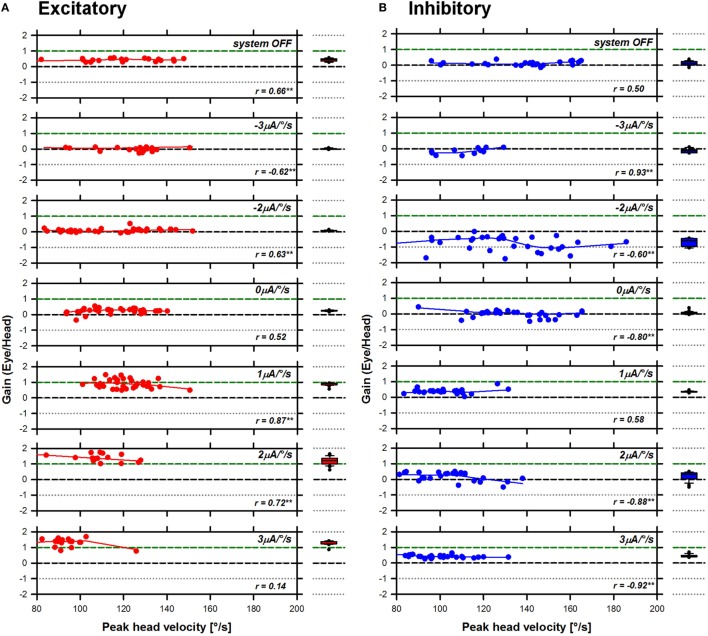
Figure 5.
Angular vestibulo-ocular reflex (aVOR) gains recorded for S3 right anterior–left posterior in all experimental conditions. Panel (A) presents data gathered during excitatory head impulses (red plots), and panel (B) presents data gathered during inhibitory head impulses (blue plots). The line and scatter plots in the main panel present individual aVOR gains (scatter) as well as their corresponding smoothed (LOWESS, see Materials and Methods) values (lines) as a function of peak head angular velocity. The insets in the graph present the result of the statistical analysis for each condition (Pearson’s product-moment correlation coefficient; **p < 0.001—two-tailed). The box plots to the right present the median values, as well as the 25th–75th percentiles of the smoothed data pooled across head velocities. The error bars represent the 10th and 90th percentiles and the symbols present all outliers outside this range.

