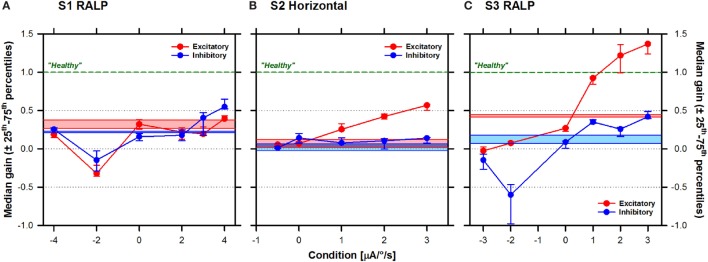
Figure 6.
Median (±25th–75th percentiles) angular vestibulo-ocular reflex (aVOR) gains (vertical axis) for the three patients as a function of stimulation condition (horizontal axis): (A) S1 right anterior–left posterior (RALP), (B) S2 horizontal, and (C) S3 RALP. Note that a transfer function with a slope of 0 µA/°/s corresponds to constant amplitude electrical stimulation that is not modulated by motion (i.e., baseline stimulation only). Results for excitatory head impulses are plotted in red and results for inhibitory head impulses are plotted in blue. Results without electrical stimulation (system OFF) are presented as the colored solid bars in the graph. The green dotted line represents the theoretical aVOR gain of 1 for a normal subject with a “healthy” vestibular system.

