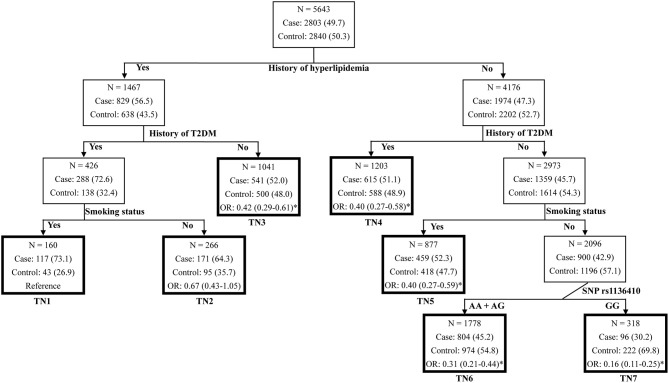
Figure 1.
Classification and regression tree for history of hyperlipidemia, history of T2DM, smoking status, and SNP rs1136410 in the merged set. Terminal nodes (TNs) are thick bordered. ORs and 95% CIs were calculated by logistic regression after adjusting for age, sex, smoking status, alcohol drinking status, BMI, and histories of hypertension, hyperlipidemia and T2DM. *P < 0.05.

