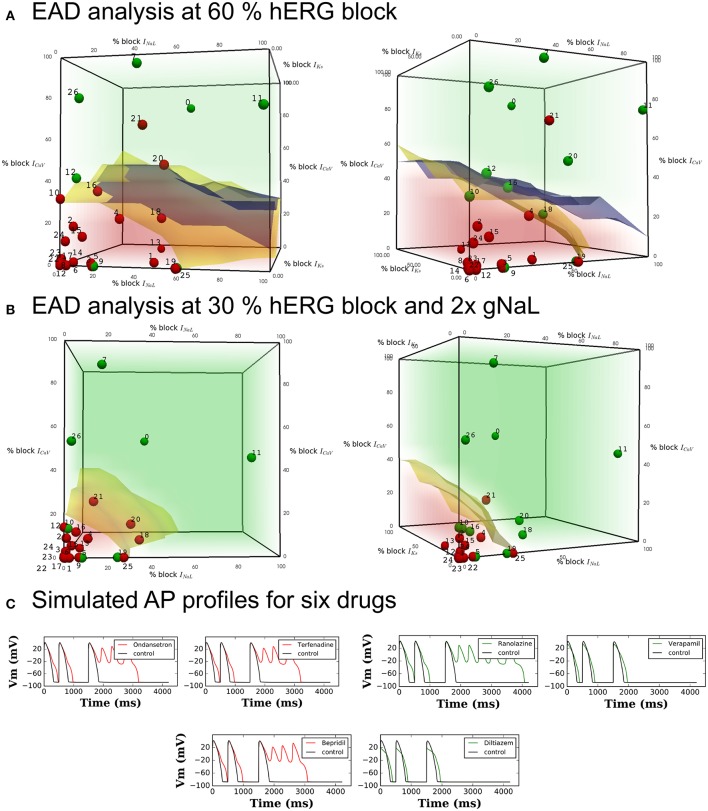
Figure 2.
Pause-induced EAD generation: combination of 0–100% ICaL, INaL, and IKs blocks tested at (A) 60% hERG block in the OHR and OHRmv (B) 30% hERG block in the OHRmv that is modified to simulate LQT3 through increase in late sodium current conductance by 2-fold. Red regions cover the set of combinations of the blocks of the three channels that induced EADs in the model. Green region covers the set of combinations where EADs did not appear. Blue and yellow surfaces represent the separation between the EAD+ and EAD− region in OHR and OHRmv, respectively. The blue and yellow surfaces are plotted together in both plots in (A) to allow for easy comparision, but note that the red and green regions corresponds to the results for the OHR model. Block of ICaL, INaL, and IKs at drug concentrations equal to 60 and 30% hERG block are calculated from in-vitro patch-clamp data in Crumb et al. (2016) using (Equation 1) and represented as dots in the parameter space of (A,B), respectively. The drugs with torsadogenic potential were plotted as the red dots, while drugs with no known torsadogenicity risk are plotted as the green dots for two different TdP definitions. Definition 1 (left panels) - TdP+: Drugs in R1, R2, R3, CH1, CM1 or torsade label. Definition 2 (right panels) - TdP+: Drugs in CM1 and CM2. The data points for the Dataset 5: 0-Amitriptyline, 1-Azithromycin, 2-Bepridil, 3-Chloroquine, 4-Chlorpromazine, 5-Cibenzoline, 6-Cisapride, 7-Diltiazem, 8-Dofetilide, 9-Flecainide, 10-Lopinavir, 11-Mexiletine, 12-Mibefradil, 13-Moxifloxacin, 14-Nilotinib, 15-Ondansetron, 16-Propafenone, 17-Quinidine, 18-Quinine, 19-Ranolazine, 20-Ritonavir, 21-Saquinavir, 22-Sertindole, 23-Sotalol, 24-Terfenadine, 25-Toremifene, 26-Verapamil. Three drugs (Amiodarone, Lidocaine and Rufinamide) with hERG ratio greater than 200 were not included in the plot. (C) Transient AP profiles at 200th beat obtained from simulation of six drugs in the OHR model. Red and green traces show that the drug is defined as TdP+ and TdP−, respectively.

