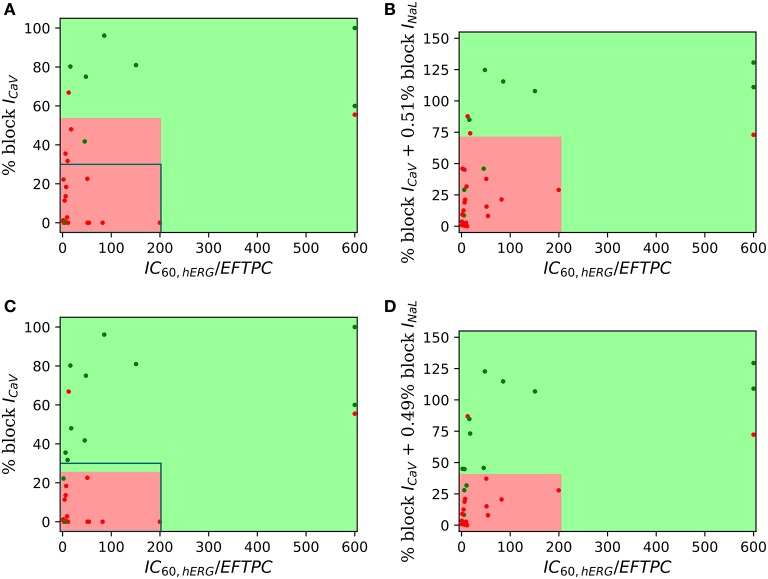
Figure 4.
Two-dimensional TdP risk map for Dataset 5 (Crumb et al., 2016). The region in green is a low risk region and the region in red is a high risk area. Red dots () indicate TdP+ drugs and green dots () indicate TdP− drugs. Blue rectangle outlines the separation of EAD+ (<30% CaV block) and EAD− (> 30% CaV block) regions. The misclassified drugs are (A) Ranolazine (CM3, CP3), Cibenzoline (R5), Mibefradil (R4), Saquinavir (CM2) and Amiodarone (CM1, R1); (B) Cibenzoline, Ranolazine, Mibefradil, Ritonavir (CM3), Saquinavir and Amiodarone; (C) Cibenzoline, Ranolazine, Quinine (CM3), Saquinavir and Amiodarone; and (D) Cibenzoline, Ranolazine, Chlorpromazine (CM1), Saquinavir and Amiodarone. (A,B) TdP Definition 1: TdP+: Drugs belonging to R1,CM1,CH1 category or drug label has TdP warning. (C,D) TdP Definition 2: TdP+: Drugs belonging to CM1 or CM2 category.

