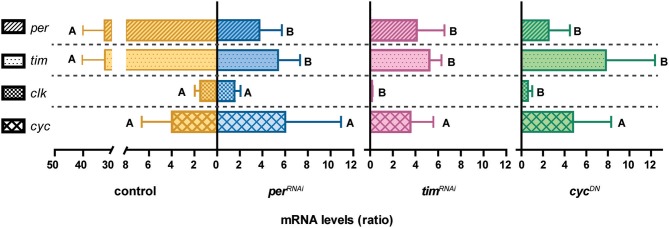
Figure 2.
Different clock components trigger dampened molecular oscillations. For each gene, the ratio describing higher/lower mRNA levels is plotted (that is, CT14/CT2 for per, tim and cyc; and CT2/CT14 for clk). Levels are normalized to the reference gene rpl49. Statistical analysis was performed comparing individual transcript levels (indicated by a dashed line). The genotypes analyzed are as follows: control (orange), perRNAiI (blue), timRNAiI (pink), and cycDN (green), under tim-Gal4. Different letters indicate statistically significant differences with a p < 0.05 (One-way ANOVA with a Tukey post-hoc test). Three independent experiments were performed.

