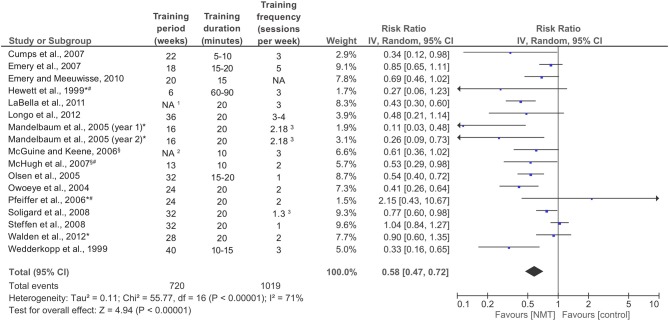
Figure 3.
Forest plot with individual studies' injury risk ratios (IRRs) and the overall pooled IRR; IV, inverse variance; CI, confidence interval; NMT, neuromuscular training. *Knee injury data only; §Ankle injury data only; #Cohort studies; 115–18 (basketball); 9–12 (soccer); 2One highschool preseason + season (soccer, basketball); 3Data provided by the author.

