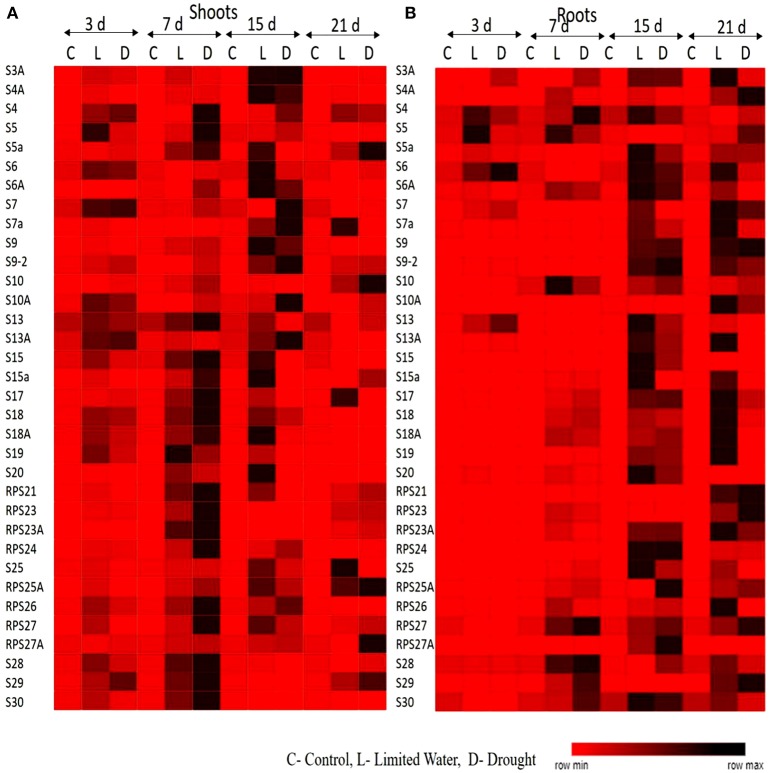
Figure 2.
Heat map representation of expression pattern of RPS genes in response to limited water and drought conditions. The expression pattern of RPS genes in (A) shoot and (B) root tissues were represented in the form of heat maps. The final fold change was normalized using ΔΔCT method with two reference genes (act1 and β-tub).

