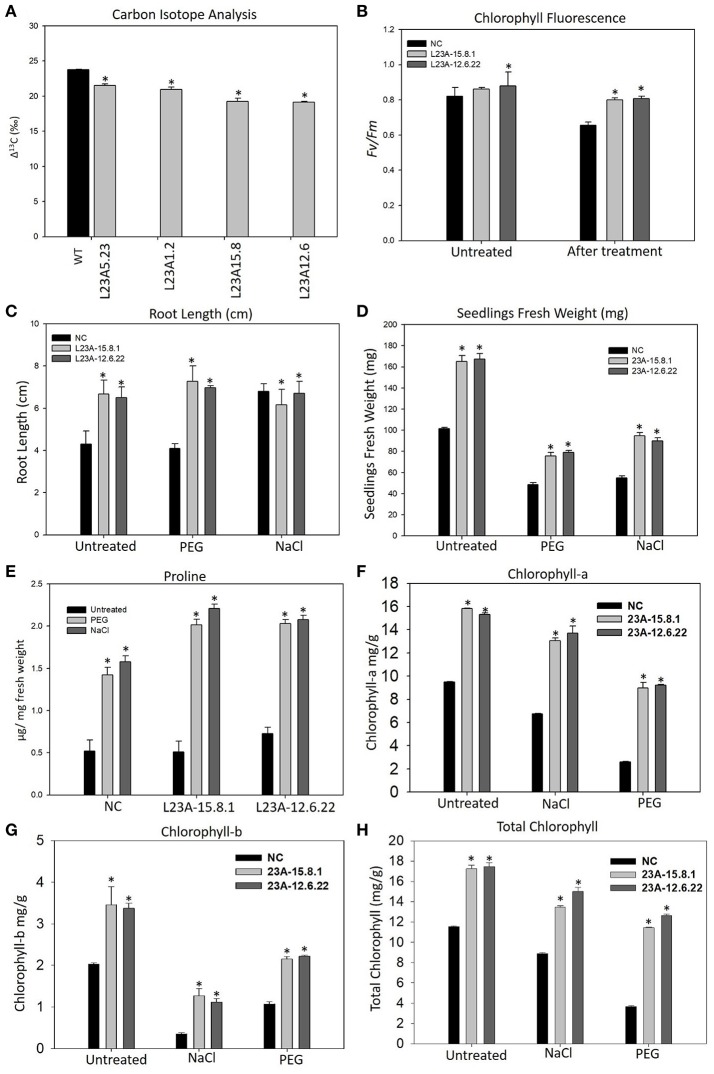
Figure 6.
Physiological analysis of high expression lines of RPL23A. (A) The Δ13C measured in two high, L23A-15.8 and L23A-12.6, and two low expression, L23A-5.23, L23A-1.2 lines in T1 generation had values of 19.24, 19.14, 21.5, and 20.9‰, respectively with respect to NS which had 23.75‰. (B) The chlorophyll fluorescence of two selected lines in the T2 generation, performed with MINI-PAM had 0.86 and 0.88 under normal conditions, whereas under limited water conditions, both the lines showed Fv/Fm of 0.80. (C,D) The T3 transgenic seedlings showed increased growth parameters at seedling stage under normal and treated conditions with respect to NC. The primary root was considered to calculate the root length using a 1 cm scale bar. (E) Proline content of T3 transgenic and NC seedlings with and without PEG and NaCl treatments. (F–H) Chlorophyll measurements in the T3 generation transgenic seedlings. The seedlings exhibited high levels of (A,B) and total chlorophyll contents with respect to NC. Mean values of chlorophyll data with ± standard error represented with asterisks were considered statistically significant at P < 0.05.

