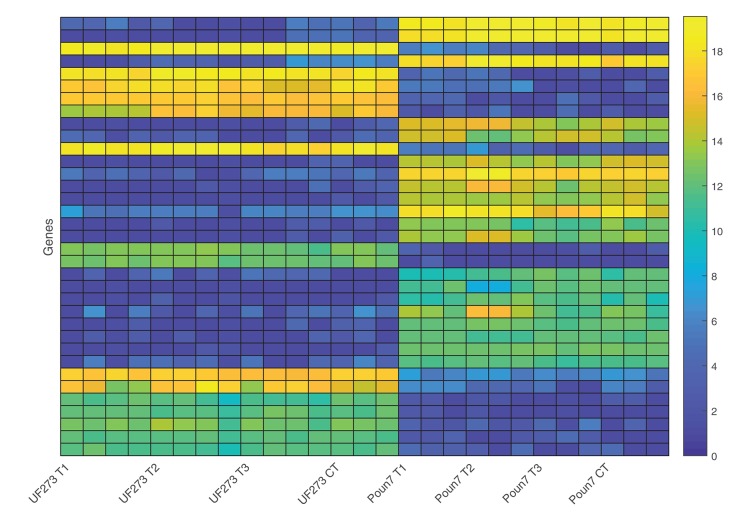
Figure 6.
Visualization of expression magnitude using RoDEO for the 35 gene models with significant differential expression (RoDEO DE score > 10) among cultivars. Blue corresponds to low read counts, and yellow corresponds to high read counts for the genes, shown in order of decreasing DE. The UF 273 Type 1 and POUND 7 expression for these genes is clearly and consistently different. UF 273 Type 1: 4 frosty pod samples per time-point and three controls (one per timepoint). POUND 7: 3 frosty pod samples per time-point and three controls (one per time-point).

