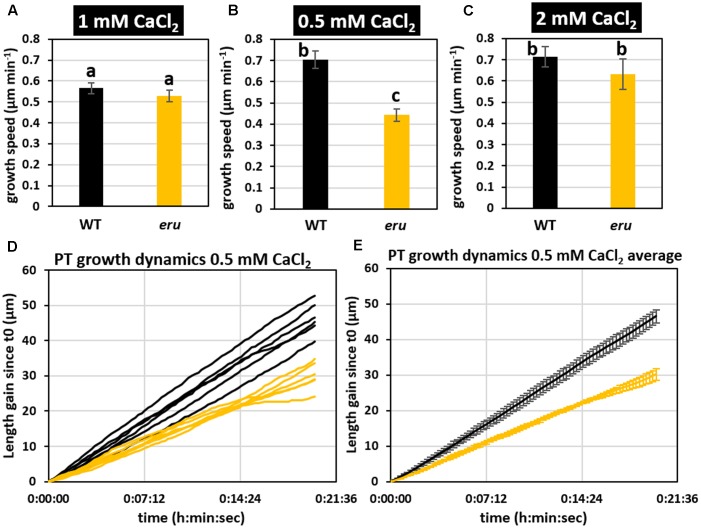
FIGURE 2.
Wild type and eru PT growth rates differ in low [Ca2+]ext conditions. (A) WT and eru PT growth rate on standard (1 mM CaCl2), (B) low calcium (0.5 mM CaCl2), and (C) high calcium (2 mM CaCl2) growth medium. (D) PT growth dynamics of WT and eru PTs grown in low calcium (0.5 mM CaCl2) conditions. Individual traces are represented by black (WT) and orange (eru) lines. (E) Average of the PT growth dynamics presented in (D). Error bars represent SE. Different letters reflect a pairwise significant difference (α ≤ 0.05).

