Figure 6.
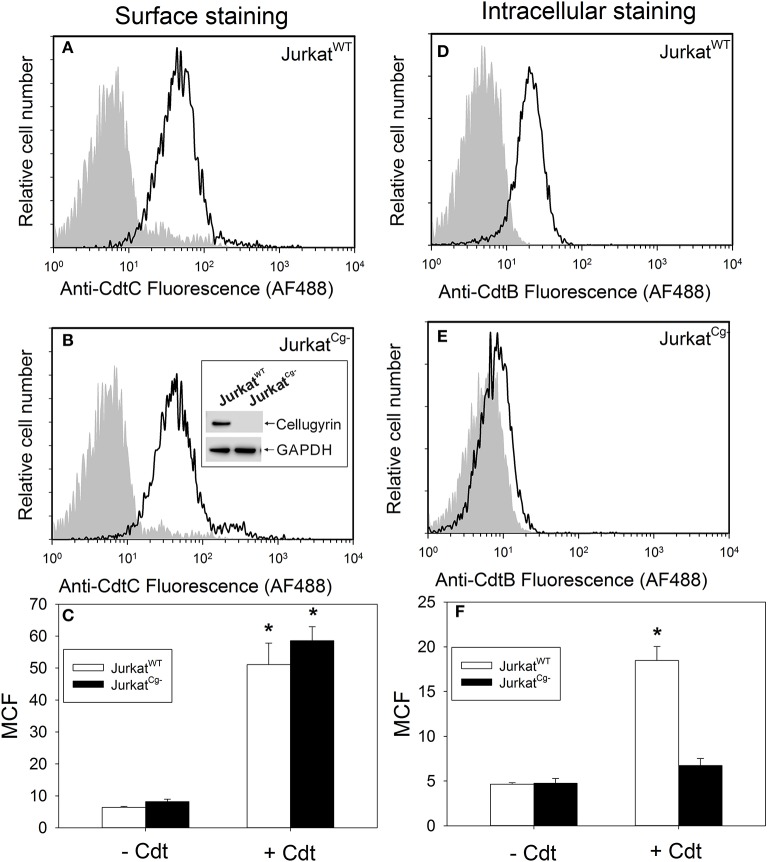
Cdt binding and CdtB internalization in JurkatWT cells vs. JurkatCg− cells. JurkatWT and JurkatCg− were first compared for their ability to bind Cdt (A–C). Cells were incubated for 60 min at 5°C with Cdt (2 μg/ml), washed and stained for the presence of cell surface associated Cdt using anti-CdtC mAb conjugated to AF488. Representative flow cytometric analysis for Cdt binding to JurkatWT is shown in panel A; solid line is the result obtained with Cdt-treated cells and the shaded curve represents cells exposed to medium alone. Cdt binding to JurkatCg− cells is shown in (B). Cells were generated as described in Materials and Methods; confirmation of their inability to express cellugyrin was demonstrated by Western blot as shown in (B) inset. Results from multiple experiments are shown in (C); results are the MCF ± SEM obtained from three experiments. Internalization of CdtB in JurkatWT and JurkatCg− cells was analyzed following exposure to Cdt (2 μg/ml) for 1 h at 37°C; cells were washed, fixed, permeabilized, and stained with anti-CdtB mAb conjugated to AF488. Representative results are shown for JurkatWT in (D) and for JurkatCg− in (E); solid line represents results obtained from cells treated with Cdt and the shaded curve from cells exposed to medium only. Results from multiple experiments are shown in (F); results are the MCF ± SEM obtained from three experiments. *Indicates statistical significance (p < 0.05) when compared to control (-Cdt) cells.

