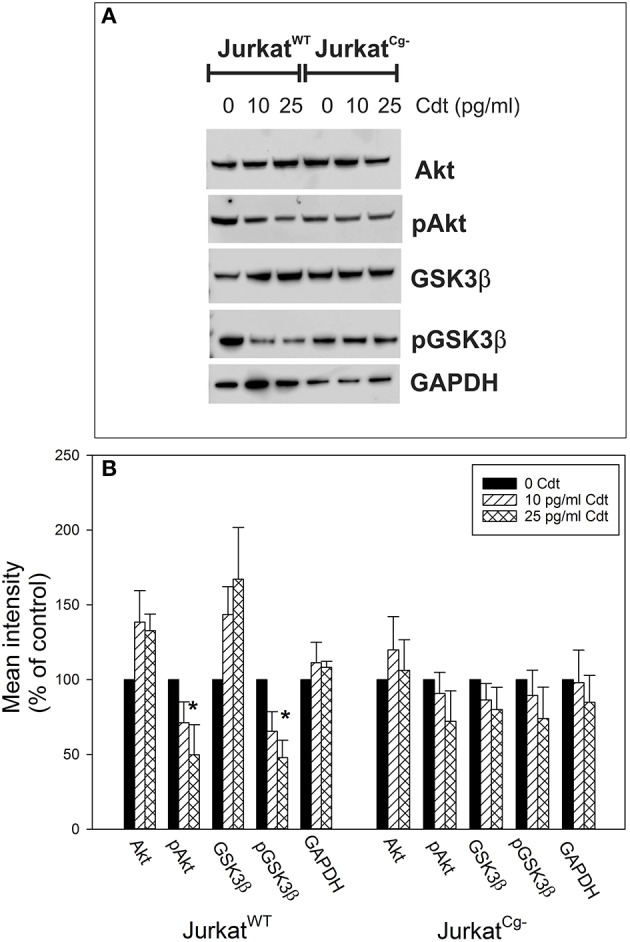
Figure 7.

Comparison of the effects of Cdt on PI-3K signaling blockade in JurkatWT vs. JurkatCg− cells. JurkatWT and JurkatCg− cells were treated with 0–25 pg/ml Cdt for 2 h and then analyzed by Western blot for pAkt (S473), Akt, pGSK3β (S9), GSK3β, and GAPDH as a loading control. (A) Contains a representative Western blot showing the effect of Cdt on Akt and GSK3β phosphorylation. (B) Shows the results of Western blot analyses from three experiments; blots were analyzed by digital densitometry and are expressed as a percentage of the relative intensity of untreated control cells; mean ± S.E.M. for three experiments are plotted. *Indicates statistical significance (p < 0.05) when compared to untreated control cells.
