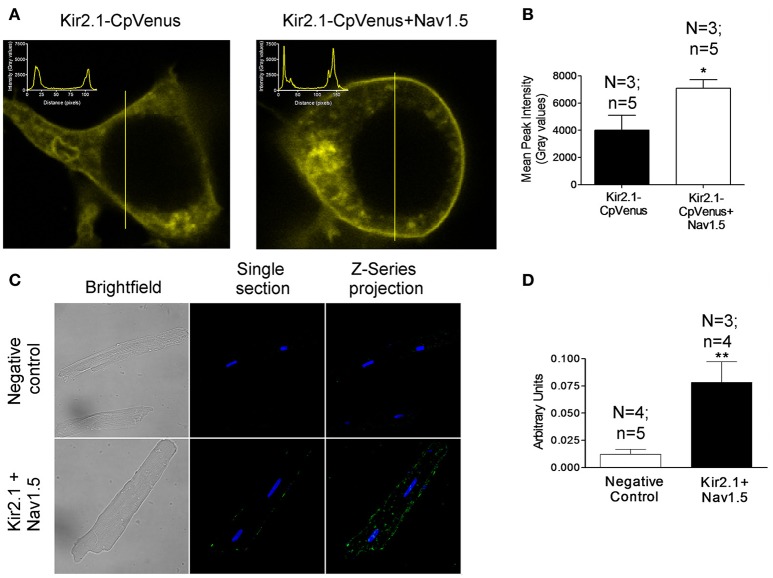
Figure 1.
Kir2.1 and Nav1.5 channels are in close proximity at the membrane of cardiac myocytes. (A) Confocal microscopy images of HEK293 cells expressing Kir2.1-CpVenus alone (left) or in the presence of Nav1.5 (right). The insets show the intensity of the signal emitted by CpVenus throughout the cell region selected (yellow line). (B) Peak mean signal corresponding to the cell membrane in cells expressing Kir2.1-CpVenus with or without Nav1.5 channels. (C) Confocal microscopy images of rat ventricular myocytes processed using Duolink® PLA. The green signal demonstrates a physical interaction between Nav1.5 and Kir2.1. Cell nuclei were visible by DAPI staining (blue). (D) Mean intensity of the green signal in the negative control and in the presence of Nav1.5+Kir2.1 antibodies. In (B,D), each bar represents the mean ± SEM of “n” cells of “N” preparations. *P < 0.05 vs. Kir2.1-CpVenus alone. **P < 0.01 vs. negative control.

