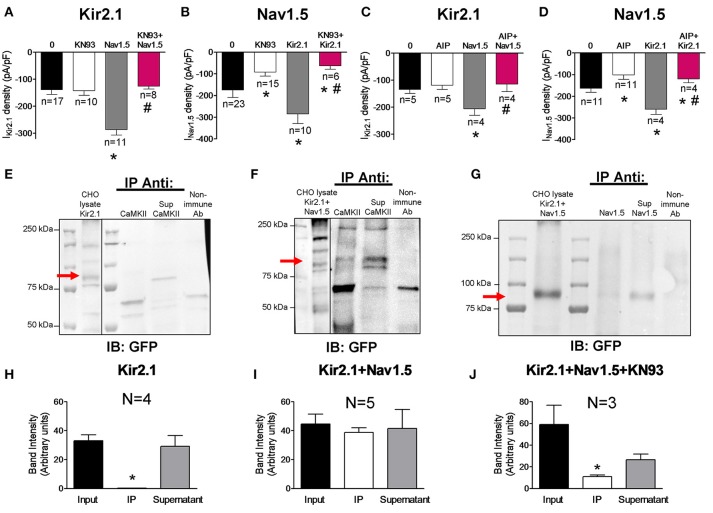
Figure 3.
Effects of CaMKII inhibition on Kir2.1 and Nav1.5 channel complexes. (A,B) IKir2.1 density at −120 mV (A) and peak INav1.5 (B) recorded in CHO cells expressing the constructs indicated, incubated or not with KN93 (1 μM-24 h). (C,D) IKir2.1 density at−120 mV (C) and peak INav1.5 (D) recorded in CHO cells expressing the constructs indicated, dialyzed or not with AIP (1 nM). (E–G) Kir2.1 did not immunoprecipitate with CaMKII in the lysates obtained from CHO cells transfected with Kir2.1-CpVenus alone (E), while partially immunoprecipitated in cells cotransfected with Nav1.5 channels (F). In the presence of KN93 (1 μM-24 h incubation), Kir2.1 did not immunoprecipitate with Nav1.5 (G). CpVenus was detected by western blot in the lysates by using an anti-GFP antibody. Also shown is the supernatant (Sup) recovered after centrifugation of the immunoprecipitant (IP). All immunoprecipitation reactions used membrane-enriched preparations. As a negative control, lysate treated with non-specific IgG (and Protein A/G) was used (“Non-immune Ab” lane). IB, antibody used for immunoblotting; IP Anti, antibody used for immunoprecipitation. (H–J) Densitometric analysis of the co-immunoprecipitation experiments depicted in (E–G) showing the mean intensity of the bands of the inputs, immunoprecipitants (IP) and supernatants. In (A–D) and (H–J), each bar represents the mean ± SEM of “n” cells of ≥2 preparations (A–D) or “N” preparations (H–J). In (A–D), *P < 0.05 vs. cells transfected with Kir2.1 or Nav1.5 channels alone; #P < 0.05 vs. cells transfected with Kir2.1+Nav1.5. For clarity the results of other statistical comparisons were not shown. In (H,J), *P < 0.05 vs. input and supernatant.

