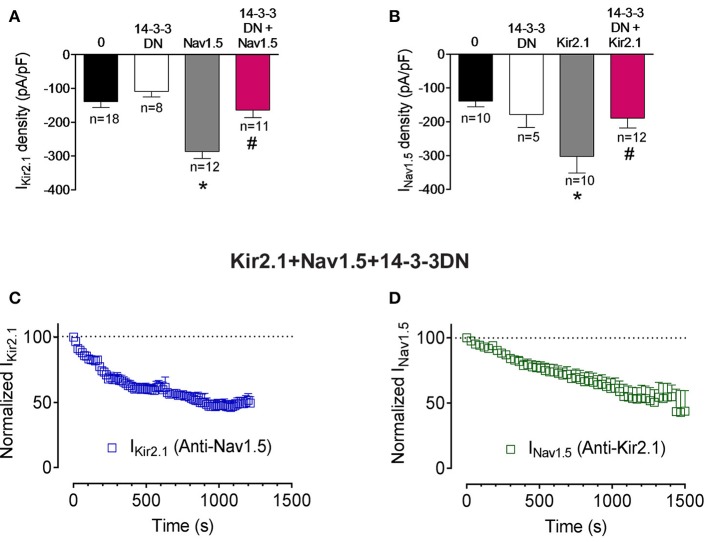
Figure 4.
Effects of 14-3-3 inhibition on Kir2.1-Nav1.5 channel complexes. (A,B) IKir2.1 density at −120 mV (A) and peak INav1.5 (B) recorded in CHO cells expressing the constructs indicated, cotransfected or not with 14-3-3DN. Each bar represents the mean±SEM of “n” cells of ≥ 4 preparations. *P < 0.05 vs. cells transfected with Kir2.1 or Nav1.5 channels alone; #P < 0.05 vs. cells transfected with Kir2.1+Nav1.5. For clarity the results of other statistical comparisons were not shown. (C,D) Normalized IKir2.1 measured at −120 mV (C) and peak INav1.5 (D) measured in the absence and presence of anti-Nav1.5 and anti-Kir2.1 antibodies, respectively, in cells cotransfected with Kir2.1, Nav1.5, and 14-3-3DN plotted as a function of time. Each point represents the mean ± SEM of 4 experiments of ≥3 preparations in each group.

