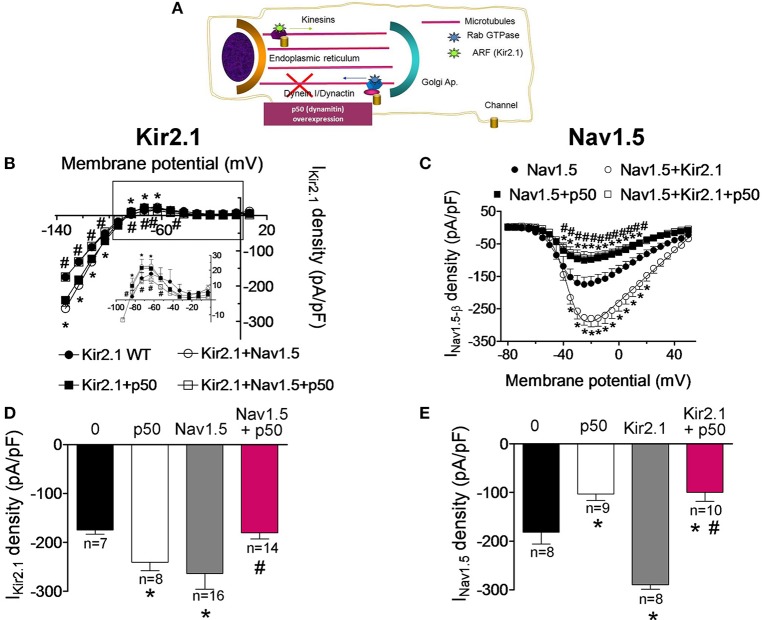
Figure 5.
Effects of the dynein/dynactin complex inhibition on Kir2.1 and Nav1.5 channels trafficking. (A) Schematic representation of a cell highlighting the role of the dynein/dynactin complex on ion channel trafficking. (B,C) Current-density voltage relationships for IKir2.1 (B) and INav1.5 (C) recorded in CHO cells expressing the constructs indicated together or not with dynamitin (the p50 subunit of dynactin) to inhibit the dynein/dynactin complex. (D,E) IKir2.1 density at −120 mV (D) and peak INav1.5 (E) recorded in cells expressing the constructs indicated alone or together with p50. Each point/bar represents the mean ± SEM of “n” cells of ≥4 preparations. *P < 0.05 vs. cells transfected with Kir2.1 or Nav1.5 channels alone; #P < 0.05 vs. cells transfected with Kir2.1+Nav1.5 without p50. For clarity the results of other statistical comparisons were not shown.

