Figure 1.
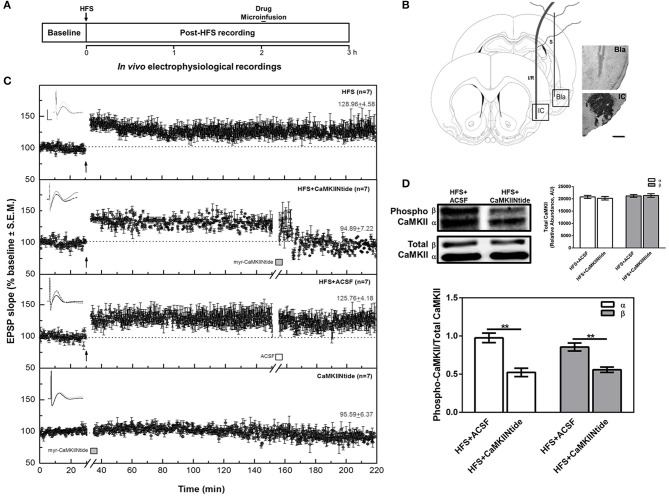
CaMKII inhibition reverts IC-LTP. (A) Schematic representation of the experimental procedure. (B) Schematic representation and representative micrographs of electrode placement showing the stimulated (S) and infused/recorded (I/R) sites in a coronal plane. The representative microphotography of IC shows the CaMKIINtide diffusion through the combination of the drug with Ponceau red. Bla, basolateral amygdaloid nucleus; IC, insular cortex. Scale bar: 1 mm. (C) Plot of IC evoked responses from HFS, HFS+CaMKIINtide, HFS+ACSF and CaMKIINtide groups. Note that the inhibition of CaMKII reverts Bla-IC potentiation. The top of each graph shows representative examples of IC field potentials obtained before (black line), 120 min after HFS (gray line) and 60 min after the infusion (dotted line). Scale bar: 5 ms, 0.5 mV. Bars indicate the infusion period (5 min). Arrows indicate HFS delivery. (D) Representative Western blots and densitometric analysis of phosphorylated and total CaMKII from HFS+CaMKIINtide and HFS+ACSF groups. Note that infusion of the inhibitor during IC-LTP maintenance phase decreased phosphorylation of CaMKII. AU, Arbitrary units. **p < 0.01.

