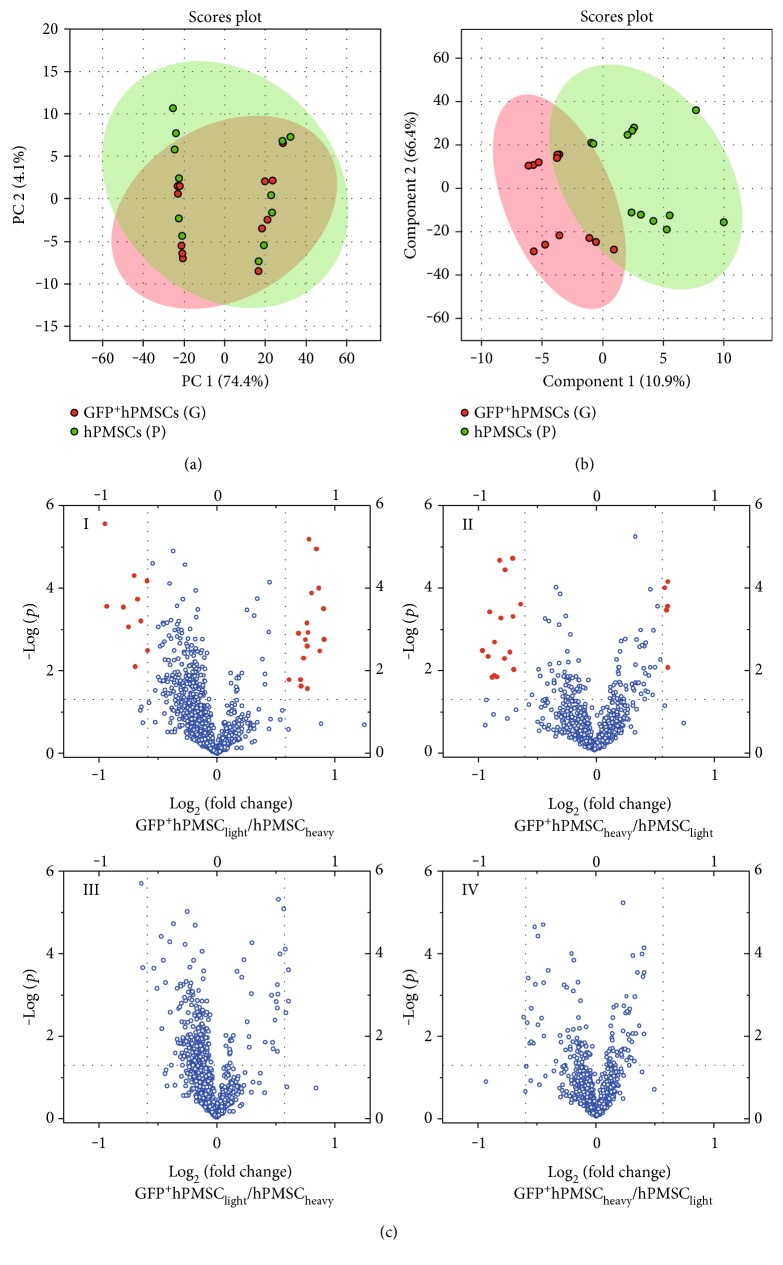
Figure 3.
Metabolomics profiling. (a) Principal component analysis (PCA) plot of all of the data obtained from the LC-MS runs. The PCA score plot showed no separation between the hPMSCs and the GFP+hPMSCs. (b) Partial least squares discriminant analysis (PLS-DA) score plots of the hPMSCs and the GFP+hPMSCs. The PLS-DA score plot did not show a clear, valid separation between the two cell groups. (c) Volcano plots. Volcano plot analyses were used to determine the significant metabolites that separated the two groups (hPMSCs and GFP+hPMSCs). The x-axis represents the log2 of the fold change (FC), which was plotted against the −log of the p value. (c)I-II: p < 0.05; data points with fold changes > 1.50 or <0.67 are labeled red. (c)III-IV: p < 0.05; data points with fold changes > 2 or <0.5 are labeled red (no such data points were observed).

