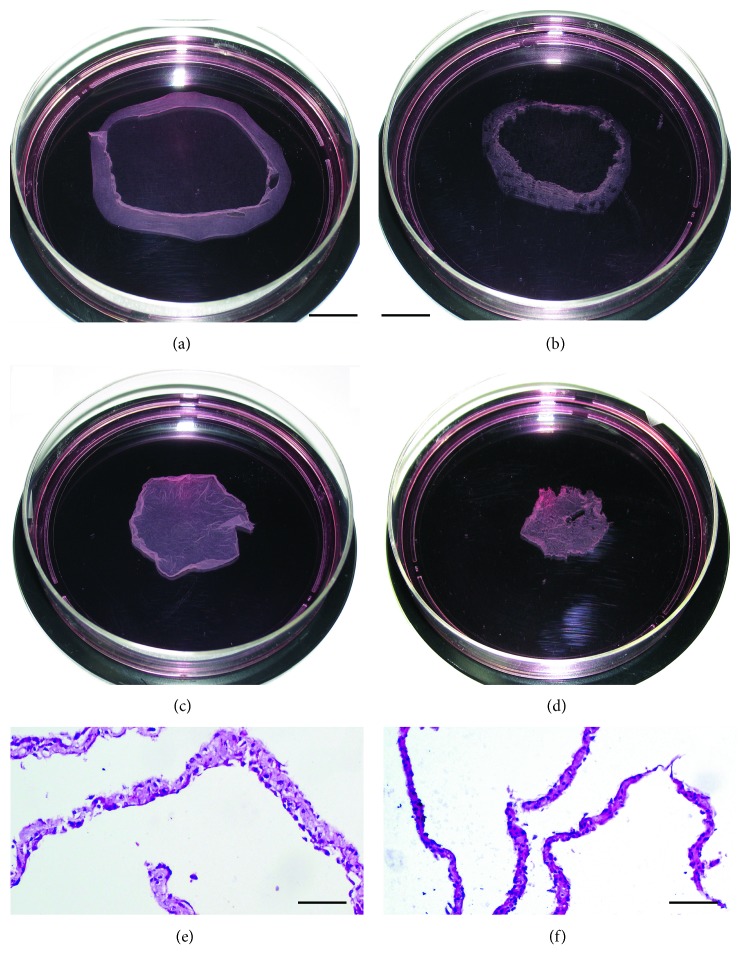
Figure 1.
The gross and microscopic appearances of MSC sheets. MSC sheet induced with ascorbic acid before (a) and after (c) detachment from the culture dish. MSC sheet induced with standard osteogenic cocktail before (b) and after (d) detachment from the culture dish. Shrinkage in both groups of cell sheets was observed after complete detachment from the culture dish. The surface area of MSC sheet induced with ascorbic acid was larger than that of MSC sheet in the osteogenic group. In addition, as seen in histological examination, MSC sheet induced with ascorbic acid was thicker (e) than the MSC sheet in the osteogenic group (f). Scale bar = 2 cm for (a, b, c, d), scale bar = 100 μm for (e, f).

