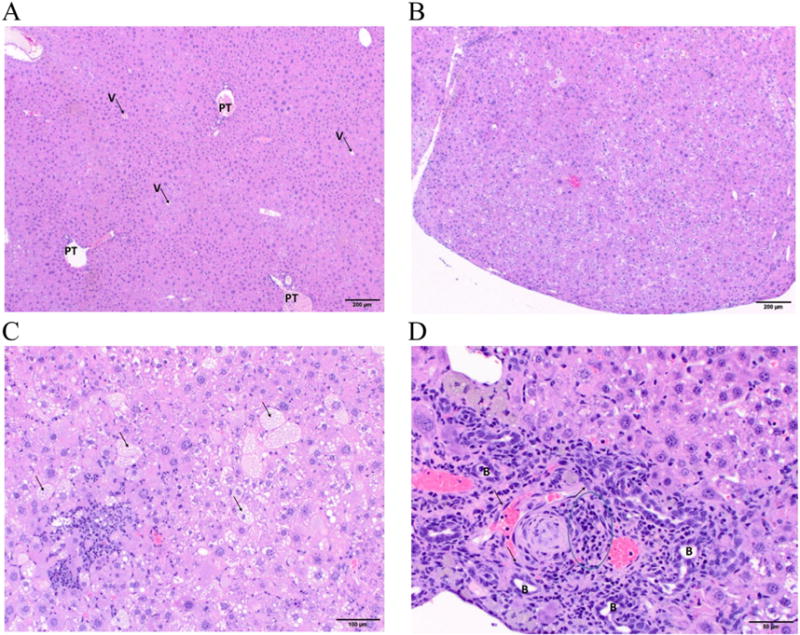
Fig. 2.

Liver histopathology in chronic TCDD exposed mice. (A) Vehicle mice: Low magnification photomicrograph of normal hepatic lobular architecture with easily identifiable portal triads (PT) and central veins (V). Hematoxylin and eosin stain, 40× original magnification, scale bar = 200 μm. (B) TCDD mice: Low magnification photomicrograph of a regenerative nodule (note bulging surface) that lacks discernable hepatic lobular architecture, due to the absence of discernable portal triads and central veins. Hematoxylin and eosin stain, 40× original magnification, scale bar = 200 μm. (C) TCDD mice: Mid-magnification photomicrograph of hepatic tissue with hepatocellular fatty change in numerous hepatocytes (arrows) and hepatocellular necrosis surrounded by a mixed inflammatory infiltrate. Hematoxylin and eosin stain, 100× original magnification, scale bar = 100 μm. (D) TCDD mice: High magnification photomicrograph of a subcapsular area with fibrosis and oval cell hyperplasia (arrows), mixed inflammatory infiltrate (outlined), and multiple profiles of proliferating biliary ducts (B). Hematoxylin and eosin stain, 200× original magnification, scale bar = 50 μm. N = 6.
