
Fig. 3.
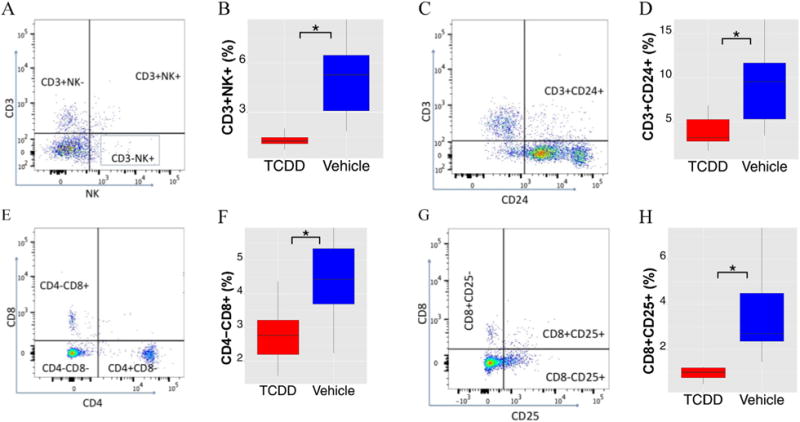
Flow cytometric analysis of splenocytes from chronic TCDD exposed mice. A, C, E, and G are representative dot plots of various cell types; B, %CD3+NK+ splenocytes; D, %CD3+CD24+ splenocytes; F, %CD4−CD8+ splenocytes; H, %CD8+CD25+ splenocytes. *, p ≤ 0.05 between VH and TCDD treatment. N = 6.