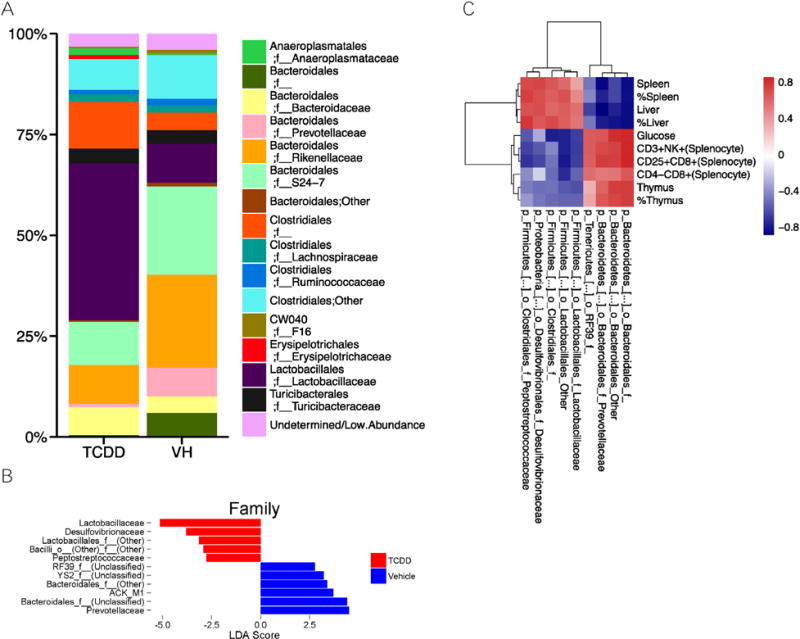
Fig. 6.

Taxonomic family level shifts in chronic TCDD exposed mice. Microbiome composition at the family level after filtering for low abundance taxa was summarized as a barchart (A). LEfSe analysis was used to determine which families were differentially abundant between treatments (B). The correlation between differentially abundant families and significantly different phenotypic endpoints were plotted as a heatmap of Spearman correlation coefficients, with hierarchal clustering based on Euclidean distance (C). N = 6.
