
Figure 1. Epigenomic profiling of Mo subsets and progenitors supports the model of Ly6Chi to Ly6Clow Mo conversion.
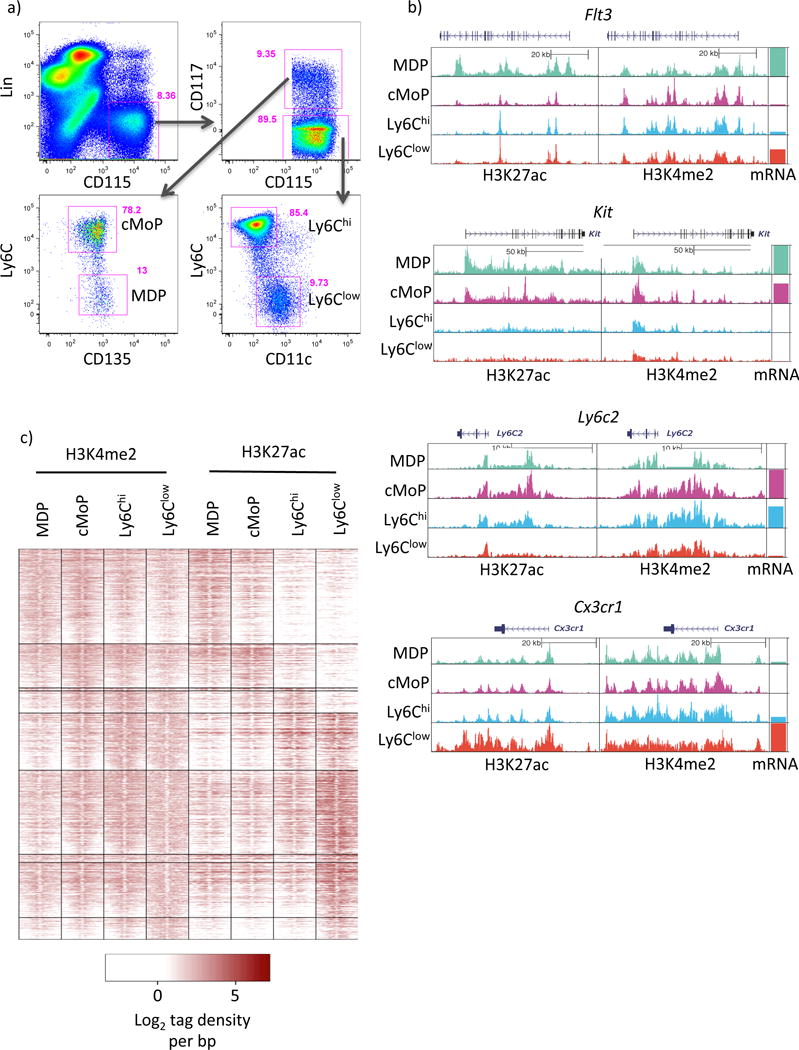
a) Gating strategy used to sort monocytes and upstream progenitors. Cells were previously gated on live singlets (using a FSC-W versus FSC-A gate). b) UCSC genome browser screenshots showing H3K27ac and H3K4me2 tag distributions at key lineage genes. c) Distribution of H3K4me2 and H3K27ac tags ±1kb from PU.1 peak centers in DE enhancers. Please see supplementary figures S1 and S2.