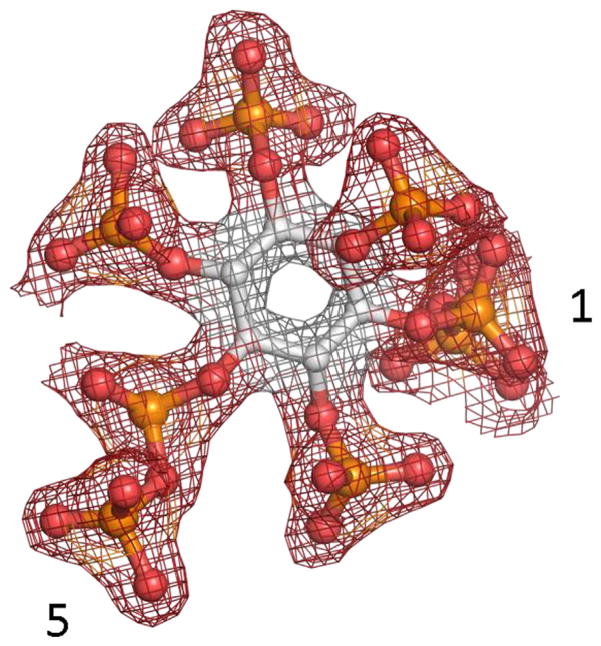
FIGURE 5.
Electron density map of 1,5-InsP8. 1,5-InsP8 is depicted as a refined 2 Fo-Fc map contoured at 2.0 ςthat is shown in blue mesh. This information was captured from crystals of the kinase domain of PPIP5K2 that also contained ADP (Capolicchio et al., 2014). The 1- and 5-diphosphate groups are numbered

