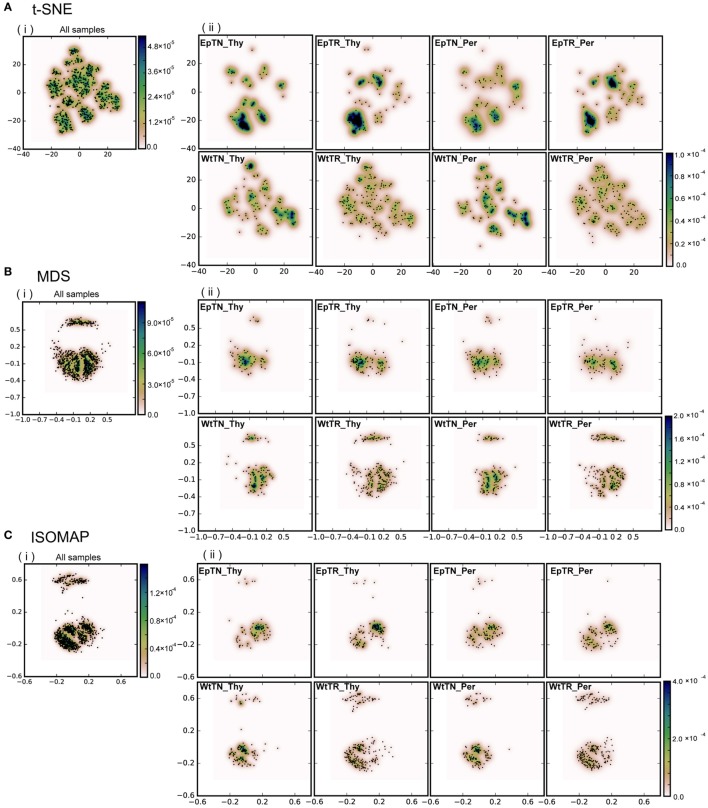
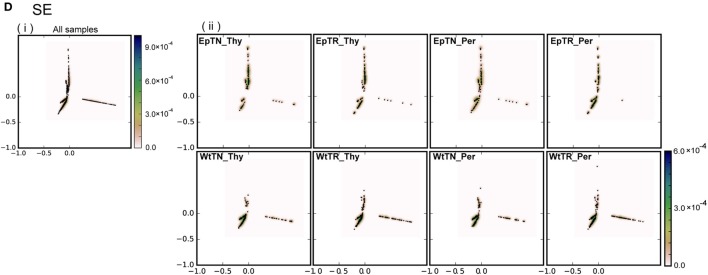
Figure 2.
Dimensional reduction with four different dimensionality-reduction methods: (A) t-SNE, (B) MDS, (C) ISOMAP, and (D) SE. Panel (i) includes the points of the total unique sequences observed in all samples. Panel (ii) includes only the portions of sequences that were observed in each sample. “Ep” and “Wt” denote two different genetic backgrounds of mice. “TN” and “TR” denote naive and regulatory T cells. “Thy” and “Per” denote the thymus and peripheral lymph nodes, respectively. For example, EpTN-Thy denotes the naive T cells that were collected from the thymus in the “Ep” mice.


