Figure 4.
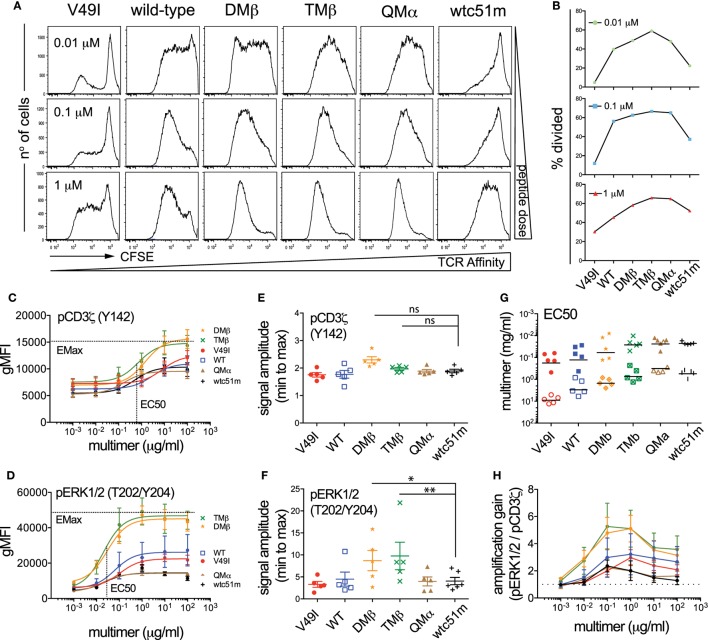
Effect of antigen dose on proliferation and T cell receptor (TCR)-mediated signal intensity and amplification of pCD3ζ and pERK1/2. (A) Proliferation analysis performed at day 7 for the indicated variant of CFSE-labeled, TCR-transduced primary CD8 T cells after stimulation with titrating doses of NY-ESO-1 antigen-pulsed irradiated PBMCs. (B) Quantification of the percentage of divided cells (frequency of dividing cells) from the proliferation histograms shown in (A). Data obtained from the different antigen doses (0.01, 0.1, and 1 µM) are depicted as individual graphs. (C,D) Average phosphorylation levels of (C) CD3ζ (Y142) (n = 5 independent experiments) and (D) ERK1/2 (n = 5) by phospho-flow following stimulation at 5 min of the indicated TCR-transduced SUP-T1 variants with titrating doses of NY-ESO-1-specific unlabeled multimers. (E,F) Quantification of the signal amplitude (from minimal to maximal Emax level) of (E) pCD3ζ (Y142) and (F) pERK1/2 for the indicated TCR-transduced SUP-T1 variants. Statistical analyses were performed with matched, one-way ANOVA tests followed by Dunnett’s multiple comparisons. Significance of the adjusted p value at α = 0.05 is given by the following symbols: ns p > 0.05 and *p ≤ 0.05, **p ≤ 0.01. (G) Quantification of the EC50 antigen dose producing half of the maximal signal amplitude for pCD3ζ (Y142) (open symbols) and pERK1/2 (plain symbols) for the indicated TCR-transduced SUP-T1 variants. (H) Quantification of the signal amplification gain (relative fold increase) from pCD3ζ (Y142) to pERK1/2 following 5 min stimulation of the indicated TCR-transduced SUP-T1 variants with titrating doses of NY-ESO-1-specific unlabeled multimers. (C–H) Each TCR variant is depicted by a distinct symbol and color code.

