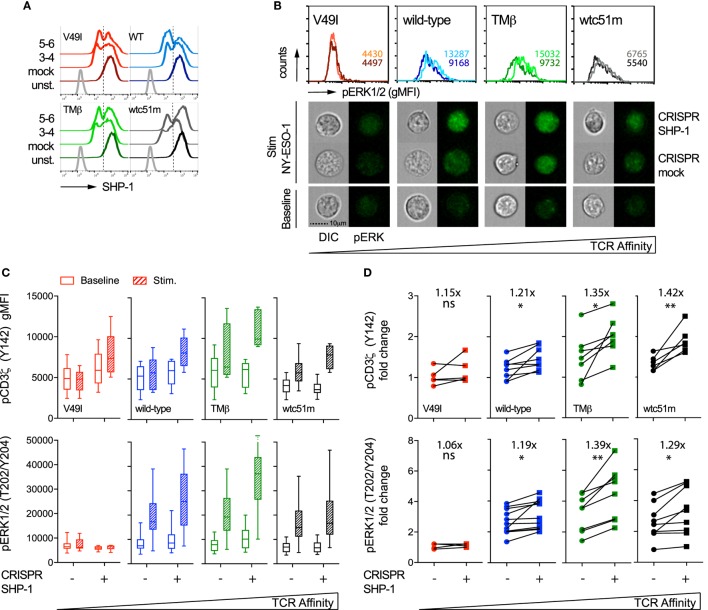
Figure 7.
Effect of partial SHP-1 knock-out by CRISPR/Cas9 on proximal pCD3ζ and distal pERK1/2 signal intensity. (A) Representative histograms of the expression levels [geometric mean fluorescence intensity (gMFI)] of total SHP-1 in T cell receptor (TCR)-transduced SUP-T1 variants following CRISPR/Cas9-mediated GFP (mock) or SHP-1 [single guide RNA (sgRNA) no 3–4 and no 5–6] targeting. Unstained (unst.) controls are shown alongside. (B) Representative quantitative (histograms in gMFI) and qualitative (cells) data acquired with the ImageStream flow cytometer depicting the expression levels of pERK1/2 in TCR-transduced SUP-T1 variants following CRISPR/Cas9-mediated GFP mock or SHP-1 targeting. Values within the histograms indicate the average expression levels (in gMFI) of pERK1/2 following CRISPR/Cas 9-mediated GFP mock (dark) and SHP-1 (dark) targeting after stimulation with NY-ESO-1-specific unlabeled multimers. (C) Quantification of the total phosphorylation levels (gMFI) of CD3ζ (Y142) (upper panels, n > 4 independent experiments) and ERK1/2 (lower panels, n > 4 independent experiments) by phospho-flow for the indicated TCR-transduced SUP-T1 variants following CRISPR/Cas9-mediated GFP (mock; −) or SHP-1 (no 5–6; +) targeting, at baseline or after 5 min of stimulation with NY-ESO-1-specific unlabeled multimers. Data are depicted as box (25th and 75th percentile) and whisker (min to max) with the middle line representing the median. (D) Comparison of the relative differences (fold change phosphorylation levels between baseline and 5 min of stimulation) of pCD3ζ (Y142) (upper panels) and pERK1/2 (lower panels) for the indicated TCR-transduced SUP-T1 variants following CRISPR/Cas9-mediated mock (−) and SHP-1 (+) targeting. Fold change (average) in phosphorylation intensity due to SHP-1 targeting is indicated for all conditions. Statistical analyses were performed with two-tailed, paired t tests. Significance of the p value at α = 0.05 is given by the following symbols: ns p > 0.05 and *p ≤ 0.05, and **p ≤ 0.01. (A–D) Each TCR variant is depicted by a distinct color code.

