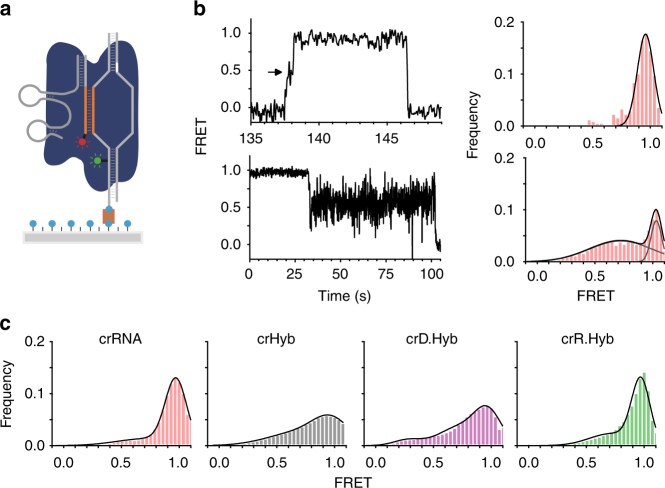
Fig. 4.
Conformational dynamics of target-bound dCas9:trRNA:crXNA complexes. a Single-molecule FRET experimental design. Surface-immobilised Cy3-labelled (green) DNA containing the AAVS1 target site (orange) and PAM site (white) binds Cy5-labelled (red) dCas9 complex (blue) to yield a FRET signal. b Representative single-molecule FRET trajectories show dCas9–crRNA complex binding in heteroduplex conformation as an increase to high FRET (top) through a transient intermediate (arrow). Irreversible conformational change into a dynamic intermediate FRET state (bottom). Corresponding time-binned FRET histograms (right), and Gaussian fits (black curves). Trajectories are 5 point averaged. c Time-binned FRET histograms for each guide: crRNA (red, n = 91); crHyb (grey, n = 57); crD.Hyb (magenta, n = 197), and crR.Hyb (green, n = 172)

