Fig. 6.
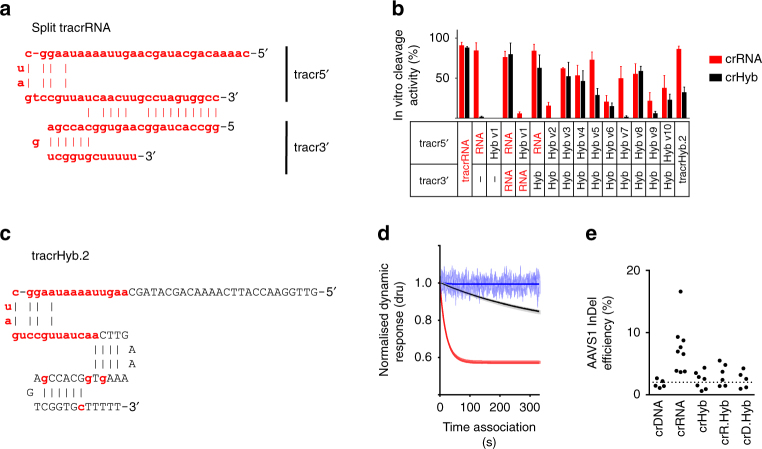
Biochemical and cellular characterisation of tracrHyb. a Design of the split-tracrRNA molecule. b Quantification of in vitro cleavage of target DNA by Cas9 complexes with crRNA (red) or crHyb (black) and combinations of single or split tracr molecules. c Design of the single tracr hybrid molecule (tracrHyb.2). d SwitchSENSE traces showing association phase of Cas9:tracrHyb.2:crXNA complexes binding to target DNA, coloured as in 3b. e Quantification of InDel events at the AAVS1 locus 5 days after electroporation of complexes composed of Cas9 and crRNA (red), crR.Hyb (green) or crDNA (black), and tracrRNA or tracrHyb.2. Dotted line shows threshold determined from crDNA samples and. For all charts, bars show mean + SD, n > 3

