Fig. 3.
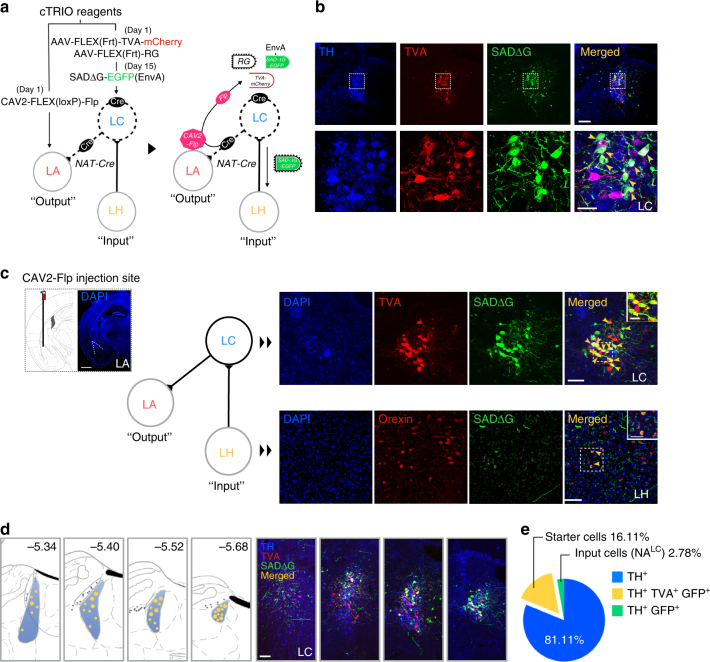
Trans-synaptic tracing of orexinLH→LC to NALC→LA circuit by cTRIO. a Experimental procedure. We injected CAV2-FLEX (loxP)-Flp into the LA of NAT-Cre mice to express Flp in LCNA neurons that send projections to the LA (Day 1). Flp-dependent AAV carrying TVA, RG were then injected into the LC(Day 1). SADΔG-EGFP (EnvA) was injected into the same site (Day 15). b Upper panels show that the starter cells (TVA+, SADΔG+ cells) in the LC are NA neurons. From left to right, TH+, TVA+, SADΔG-EGFP+, and merged cells (shown by yellow arrow heads) are shown. Lower panels, higher power images of corresponding upper panels of the rectangular regions. Scale bars, 200 μm (upper), 50 μm (lower). c Left panels, injection site of CAV2-FLEX (loxP)-Flp in the LA. Scale bar, 600 μm. Right upper panels, NALC neurons expressing TVA and SADΔG-EGFP (yellow arrow heads). Scale bars: Large window, 100 μm; small window, 30 μm. Lower panels, orexinLH neurons expressing SADΔG-EGFP (yellow arrow heads), suggesting that NALC→LA neurons receive monosynaptic input from orexin neurons. Scale bars: large window, 100 μm; small window, 50 μm. d Left four panels, distribution of starter cells (merged) in the LC region. Each small yellow dot shows one merged cell, large dot includes two merged cells. Right four panels show a representative image of starter cells in different locations of the LC. Scale bar: 100 μm. e Graph shows the percentage of TH+ (blue), TH+/TVA+/SADΔG+ (yellow), TH+/SADΔG+ (green) cells in the LC

