Fig. 5.
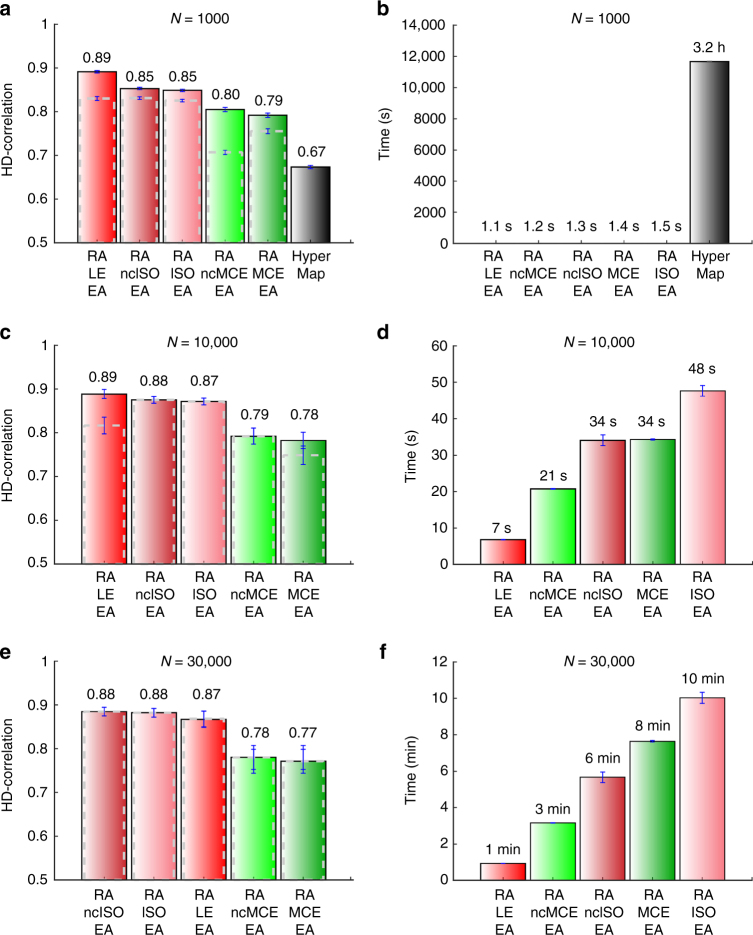
Comparison of HD-correlation and time on small and large-size popularity-similarity-optimization synthetic networks. a, c, e Average performance and standard error, measured as HD-correlation, for all PSO networks of sizes N = 1000, N = 10,000, and N = 30,000, respectively. Averages are taken over the parameters m (half of the mean node degree) and temperature T. b, d, f Average computation times for the PSO networks of sizes N = 1000, N = 10,000, and N = 30,000, respectively. Again, averages are taken over the parameters m (half of the mean node degree) and temperature T. Considering the average performance in all the simulations on 1000 nodes networks a, coalescent embedding approaches achieved a performance improvement of more than 30% in comparison to HyperMap, requiring only around one second versus more than three hours of computation time. Similar performance results are confirmed for the networks of sizes N = 10,000 and N = 30,000 with an execution time still in the order of minutes for the biggest networks. The comparison to HyperMap was not possible due to its long running time. The dashed gray bins represent the HD-correlation of the respective non-EA variants, suggesting that their performance tends to the EA variants for larger PSO networks

