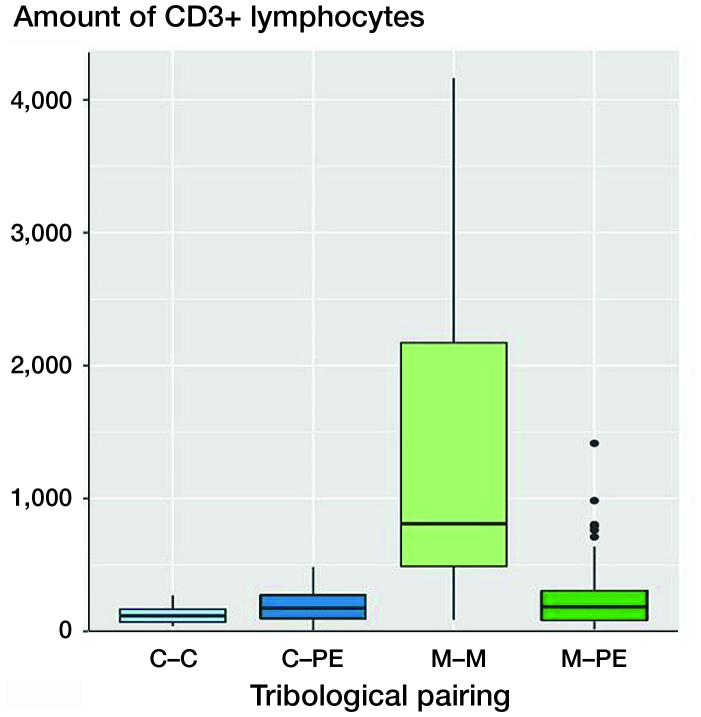
Figure 2.
Boxplots of CD3 quantities (number of CD3+ lymphocytes) of various pairings. The x-axis shows the different materials of the tribological pairings, the y-axis shows the amount of CD3+ lymphoctyes. Each black horizontal line shows the median of the group, the box below the median shows the lower quartile, the box above the median shows the upper quartile. For each group, the vertical lines are the whiskers that indicate the variability of the data outside the upper and lower quartiles. Black dots represent outliers. Metal–metal pairings (M–M) showed the highest amount of CD3+ lymphocytes. The other tribological pairings show all statistically significantly lower numbers of CD3+ lymphoctyes. C = ceramic; PE = polyethylene.

