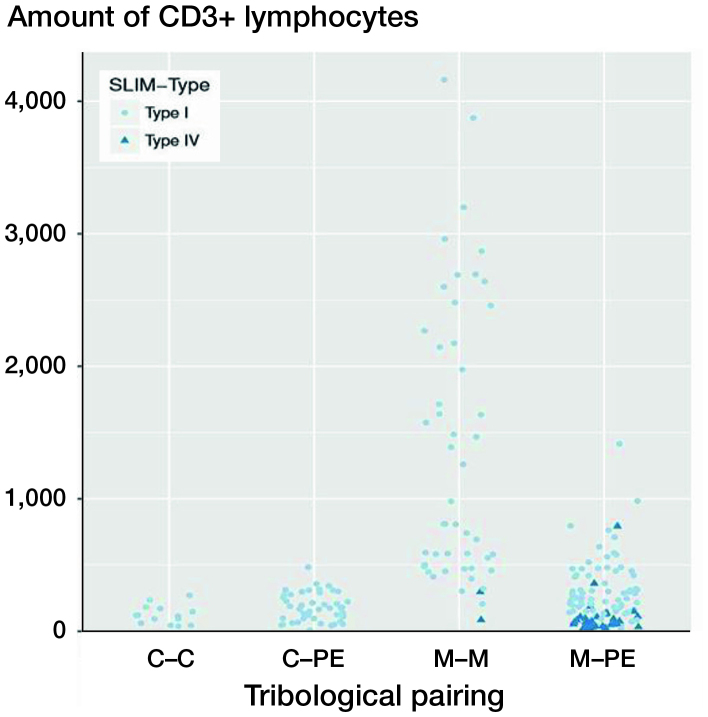
Figure 3.
CD3 quantities (number of CD3+ lymphocytes) as a function of the pairing and the SLIM types. The x-axis shows the different materials of the tribological pairings, the y-axis shows the amount of CD3+ lymphoctyes. Each dot represents a SLIM type I probe. Each triangle represents a SLIM type IV probe. Each case is represented by a pale-blue circle (SLIM type I) or a dark-blue triangle (SLIM type IV). Only the metal–metal and the metal–polyethylene groups include SLIM type IV. SLIM type IV probes show lower amounts of CD3+ lymphocytes in their group than SLIM type I probes. For abbreviations, see Figure 2 caption.

