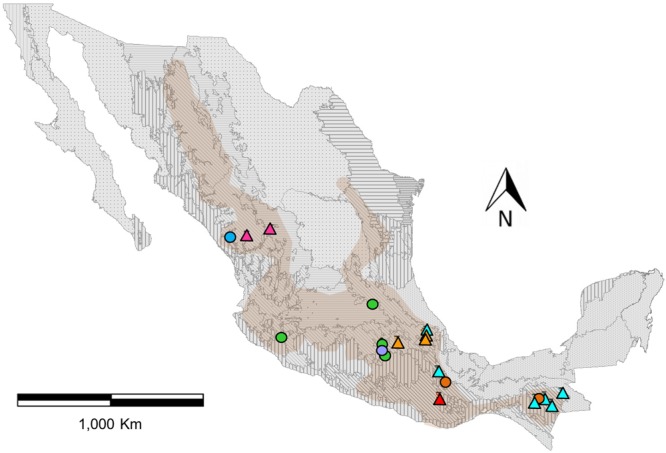
FIGURE 1.

Distribution map of genotyped populations of Phaseolus coccineus in Mexico, assigned to eight genetic clusters with the program Admixture (colors). Circles indicate wild populations and triangles show cultivated populations (Figure 2). Frames indicate the seven first-level ecoregions (9–15) present in Mexico (level 1) and boundaries represent 21 second-level nested ecoregions. Shaded area shown the potential geographical distribution of P. coccineus in Mexico (López-Soto et al., 2005).
